Chinese industrial production (IP) growth slowed in August to just 4.4% Year-on-Year (YoY), which is a 17-year low.
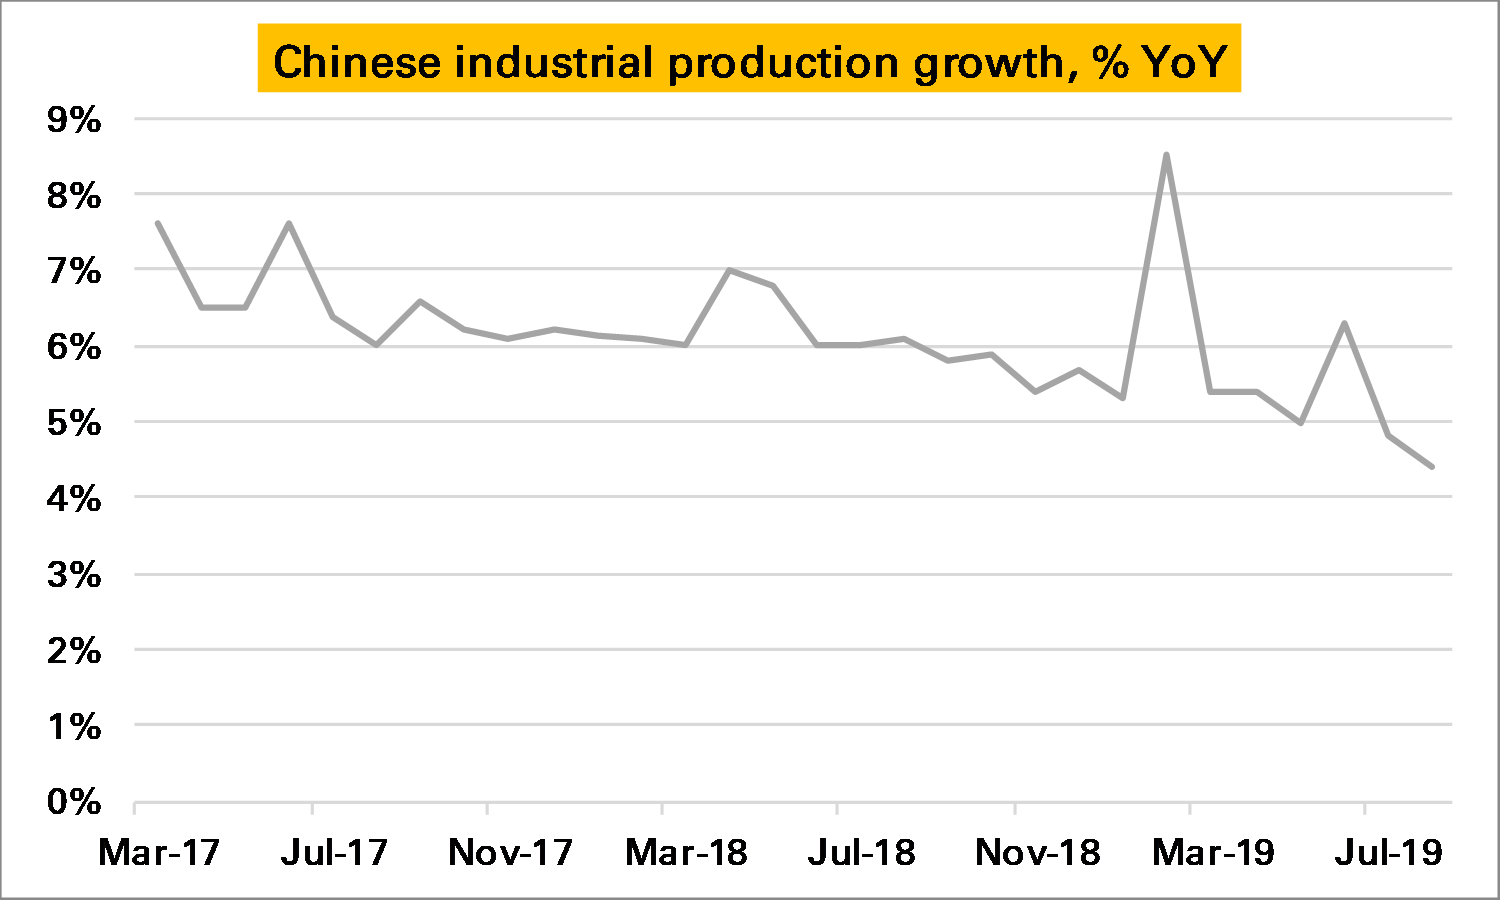
We need to keep in mind that this data is not seasonally adjusted and can show some wild swings. This is especially true in February and March, when the shifting dates of Chinese New Year have a large impact. Only five months ago in March 2019 IP growth was reported as up 8.5% YoY, clearly an aberration.
What we need is an estimate of the level of Chinese industrial production. But the National Bureau of Statistics (NBS) does not publish one.
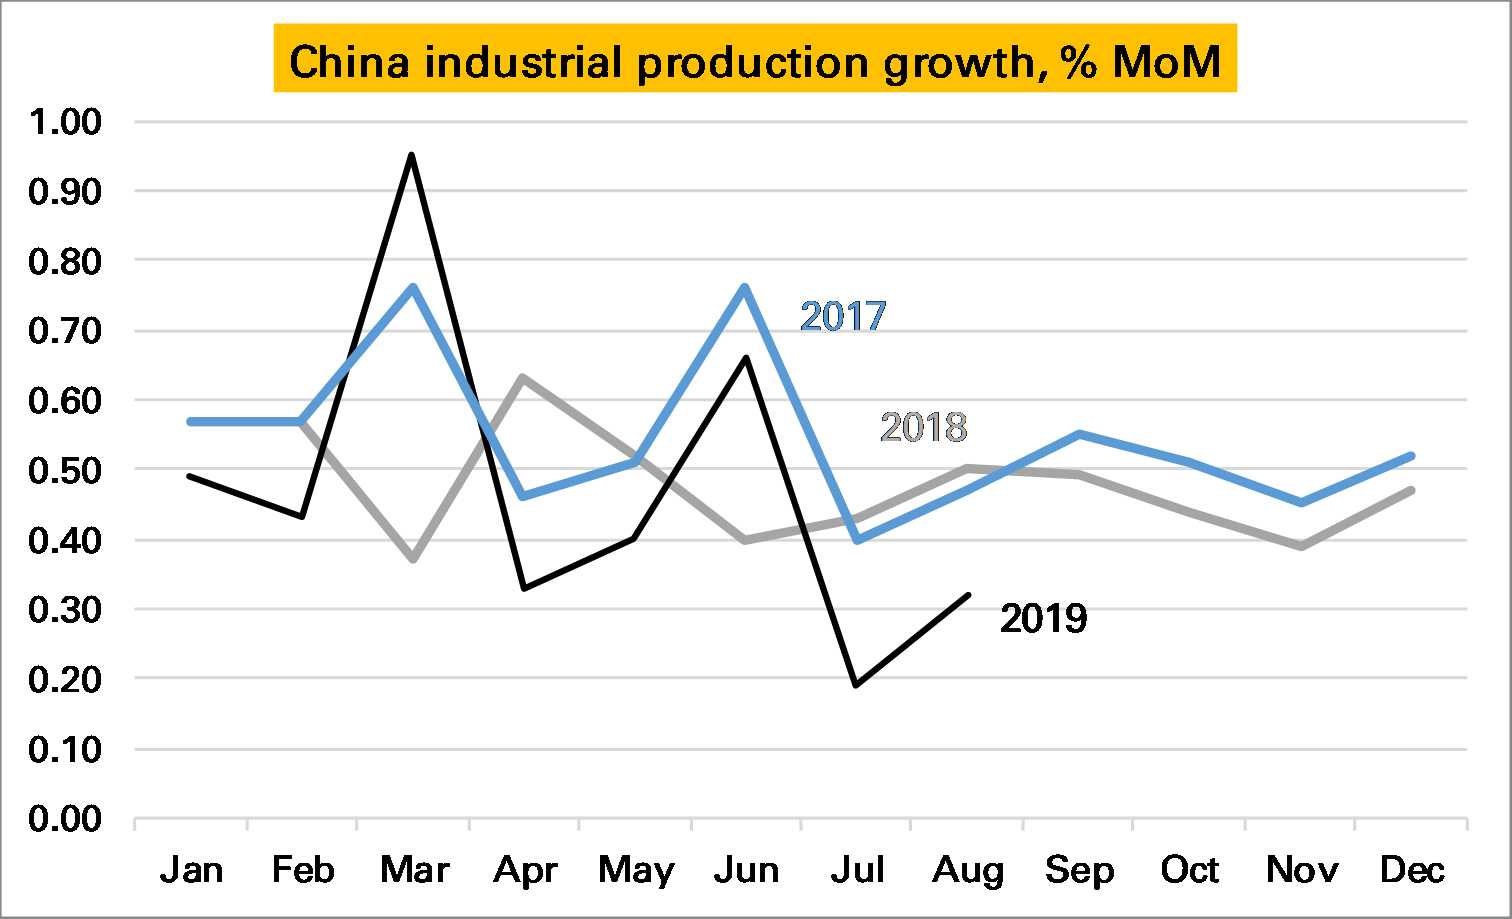
What it does publish, however, is a seasonally adjusted month-on-month (MoM) growth rate. This too is rather odd, showing distinct seasonal patterns, but in 2019 has also been trending downwards. In August it was just 0.32% MoM, the slowest rate in the last three years and a mere 4% annualised.
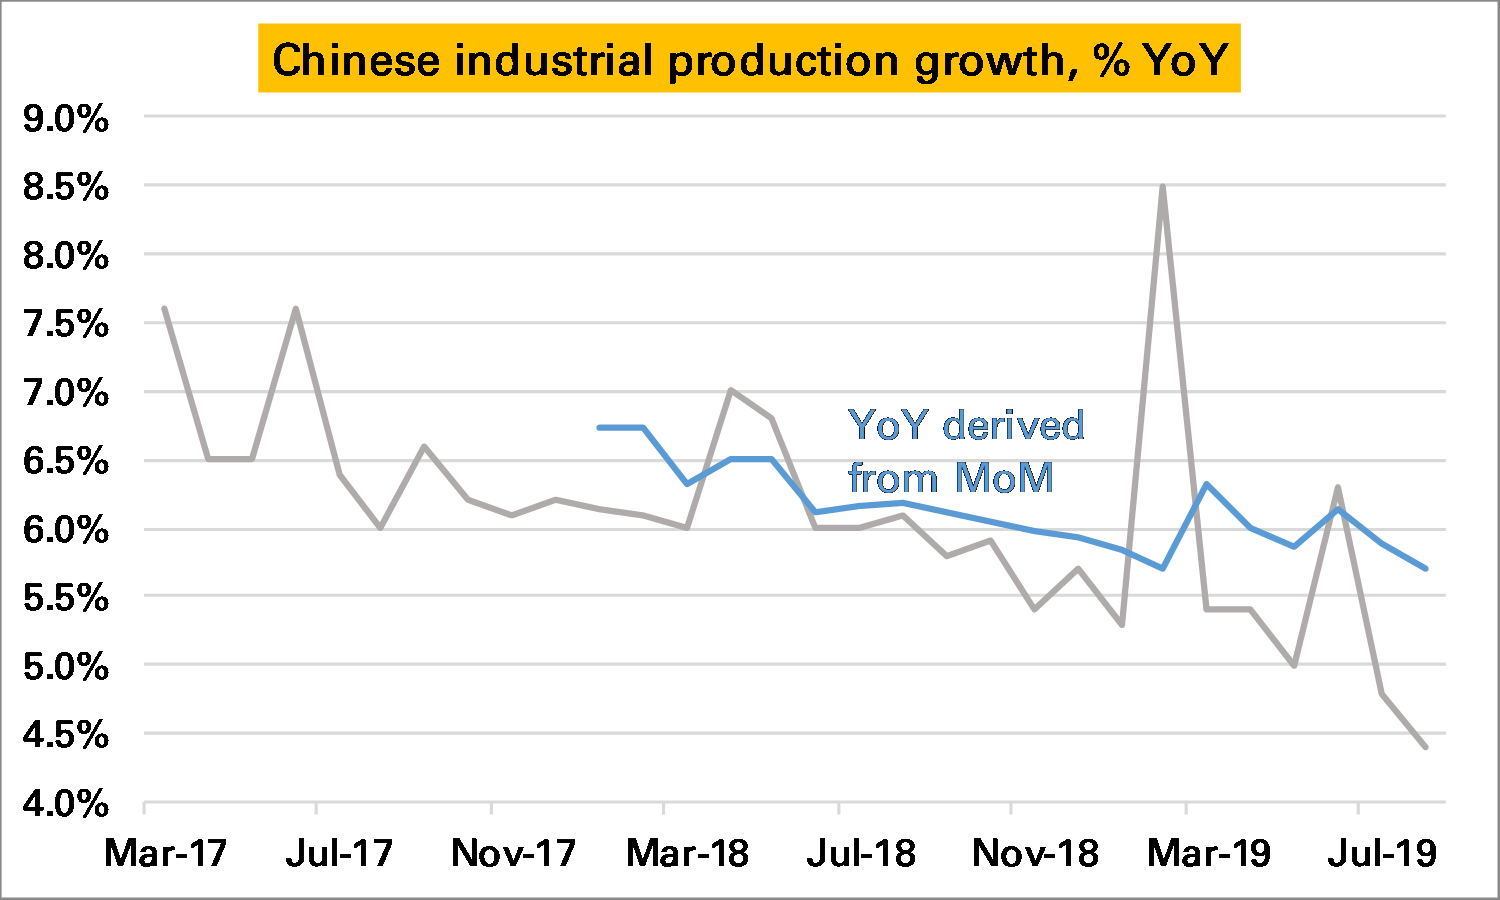
The MoM series can be used to back out a level of IP, and from this an alternative YoY growth rate. It is noticeable this paints a less pessimistic picture than the official YoY series, showing in August a YoY rate of around 5.5%. But it is also true that this backed-out series has been higher than the official series for much of the last year, somewhat of a puzzle.
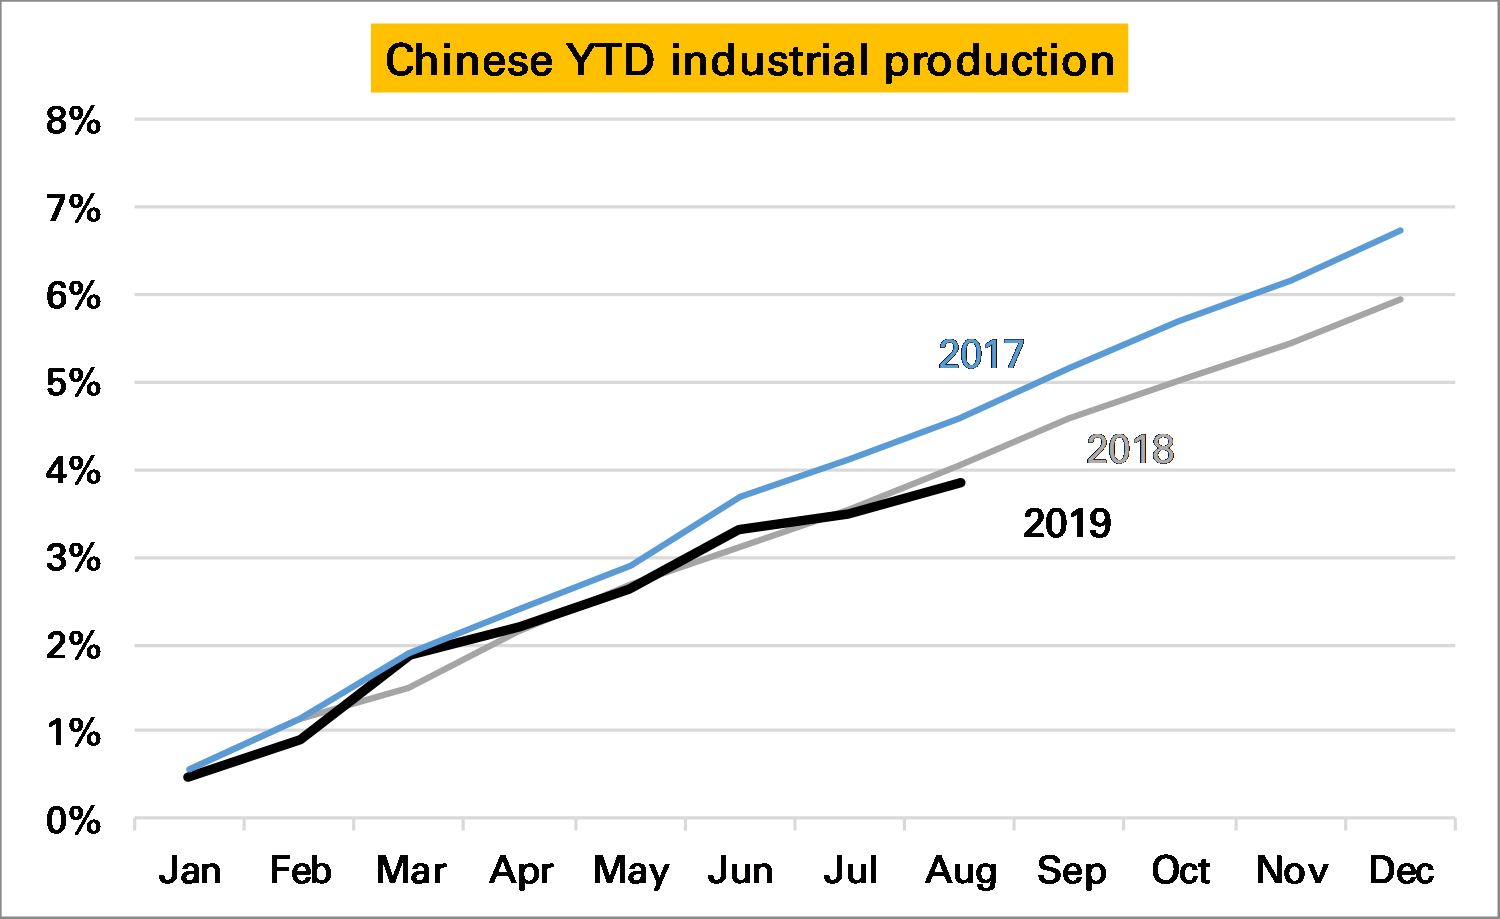
Interpreting Chinese data is never easy, even if you accept them at face value. From the NBS’s two series it seems safe to conclude IP growth is slowing, though perhaps not as severely as the YoY numbers suggest. On a YTD basis industry has expanded not much less than in 2018. But the last two months have been weak. September’s data will be interesting.