I don’t like monthly YoY data. For sure it has its advantages, in particular seasonality is normally dealt with. 1 But as a guide to what happened in the month in question it it rather lacking.
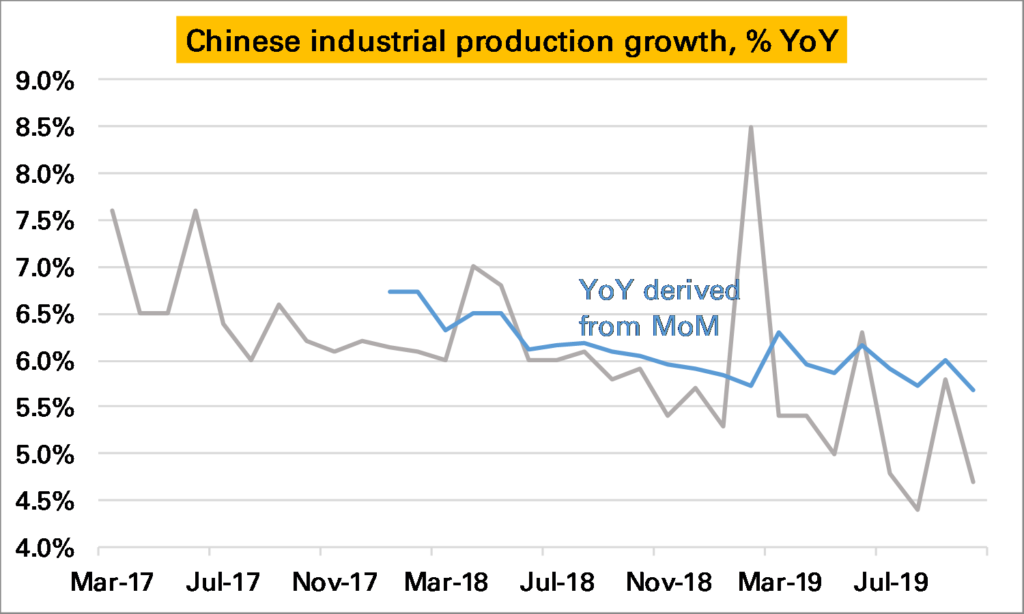
Chinese industrial production, an important datapoint for commodity demand (and the wider global economy), is normally reported as a YoY series. This has slowed steadily, and in October was just 4.7% higher YoY, a sharp slowdown from the 5.8% growth seen in September (grey line in 1st chart). However it remained higher than the low of 4.4% seen in August.
The probem with a YoY series is we don’t know whether October was a bad month, or October 2018 was a very good month, and similarly how it compares to September.
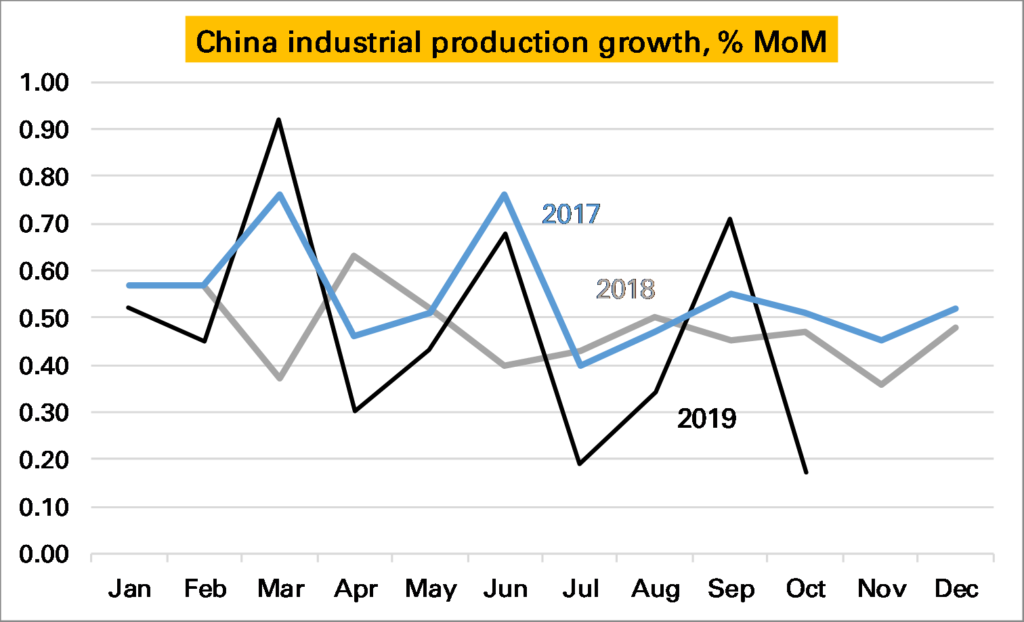
Luckily for IP, China also publishes a seasonally adjusted month-on-month (MoM) series. It doesn’t get much attention but in theory should give us a much more accurate read on how the industrial sector is doing at the moment. If so it looks very bad news – October saw growth of just 0.17% a month. This is the lowest monthly print I can remember, and as the following chart shows certainly the lowest in the last three years. If maintained for the next 12 months Chinese YoY IP growth would be just 2%.

But the chart above also shows something else – the seasonally adjusted monthly growth rate appears rather…seasonal…especially in 2019. The first month of each quarter has been weak, and the last month strong. As such it looks like November’s print is likely to be around the same as in 2018 and December’s much stronger than in 2018. This would mean the YoY rate should stay around the same in November and rise strongly in December.
There lies one more complexity. The YoY rate derived from this monthly data does not equal the YoY rate reported by the NBS. The first chart shows the former in grey and the latter (headline) in blue. Even with the weak October monthly print the derived YoY remains above 5.5%.
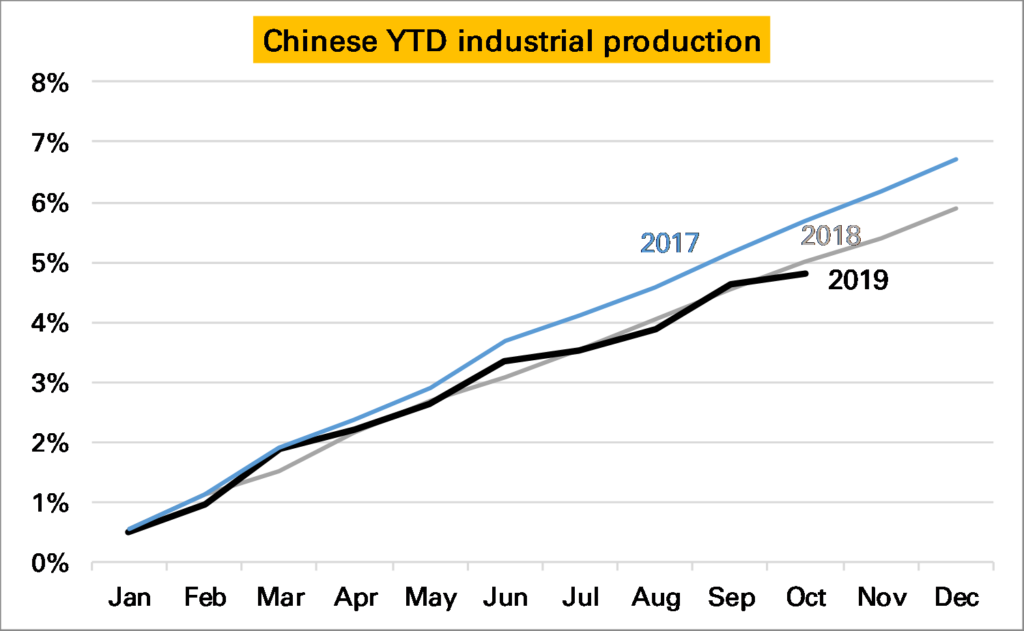
Where does that leave us? Chinese IP growth is slowing, though the YoY series might overstate the severity of the slowdown. October was a bad month, but November and December are likely to be better given the 2019 pattern so far. Given so much confusion I cling to my chart of YTD growth in industrial production derived from the monthly data. The pattern is less smooth this year but overall output has grown much the same as in 2018.

Notes:
- An obvious exception being shifting annual holidays such as Chinese New Year or sometimes Easter ↩
