It seems very important but analysts tend to ignore gold’s voluminous above-ground stocks. I’ve always thought this was a mistake, but I’m still not quite sure the best way to approach it. This is an idea I’ve had but it’s still very much a work-in-progress.
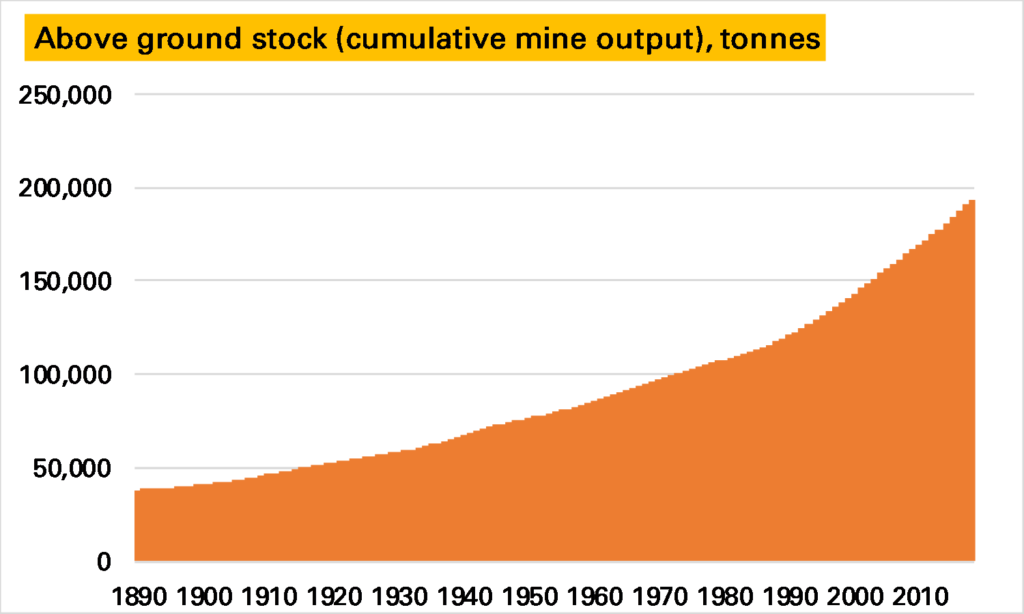
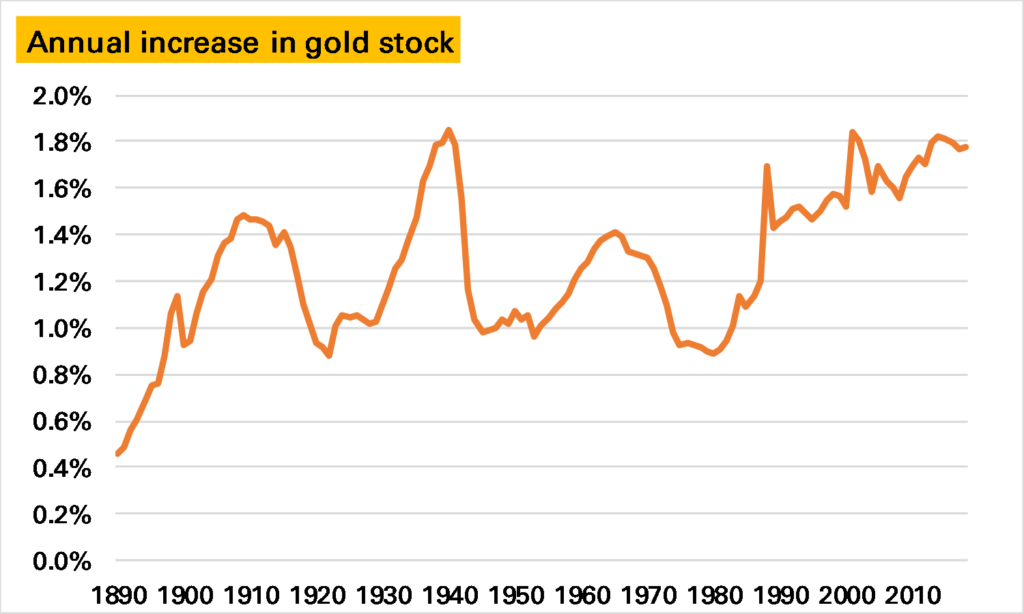
People throughout history have preferred to hold – store or wear – gold rather than consume it, and with very little deterioration very large stockpiles have steadily accumulated, rising by between 1-2% a year (see chart). GFMS 1, the research group, estimate this “above-ground stock” to be around 194,000t, some 55x annual mine supply 2.
This enormous stockpile gives (and is also a consequence of) gold’s financial-asset-like characteristics. But I’ve always thought something hasn’t quite added up about the “above-ground stocks” story. While the gold price is not very volatile compared to many other commodity prices, it seems to react far more to short-term shifts in supply & demand than you would expect of a true financial asset and given such a large inventory. To give an example, imagine all the world’s mines and wells are forced to shut 1/3rd of production for a year. The oil price would go stratospheric; gold would be far more restrained. But I think it would still go up more than a shortfall of 1,000t in a market of 194,000t would suggest 3.
How can we explain this?
One possibility is the stockpile is far smaller than most estimates. I think we can discount this. It is true the calculation is relatively unsophisticated, being essentially the sum of all historical mine production less a small assumption of gold lost forever. And it could overstate stocks if a) historical mine production has been overestimated, or b) losses have been understated, both perfectly plausible. But while over the years there have been lower calculations (see for example here), they are still many tens of times higher than current mine production; similarly even if GFMS’s ceiling of around 3,600t “unaccounted/lost” is too low 4, it is unlikely to be significantly too low.
Another explanation is that gold and gold investors are a special breed. This was suggested by Professor Anthony Neuberger in this 2001 WGC study.
Most private and institutional investors hold little or no gold. Investors who hold gold do so at least in part because gold has certain properties which make it peculiarly attractive in the event of acute political or financial instability. For these investors, gold is not readily substitutable by other assets.
In other words those who hold gold like gold as gold, not as just another financial asset, whereas most other investors don’t like gold as gold, and never the twain shall meet. Take, for example, a central bank. This argument says that hold gold as it is a unique asset of last resort, and so are unlikely to either sell it, even when the price goes a lot higher, or add more, even if it goes a lot lower. In general this means the effective potential ownership of gold is much smaller than for other financial assets, and as such the market is more internalised and hence susceptible to short-term flows.
A third, and the one I want to explore, is related to both of these – that not all gold is the same. Of course we know it is held in different forms – of the 191,000t of stocks not lost or unaccounted for, GFMS estimate 5 91,600t is held as jewellery, 23,800t other fabricated products (but not coins) 6, 42,400t as private sector investment (ETFs, bars & coins) and 32,500t by central banks. My argument would be that some of this, such as ETF gold, is far more liquid than others, say certain jewellery or fabricated products and as such is likely to play a more important role in price formation.
One way to deal with this would be to exclude some of the stocks. Neil Meader, in a 2015 presentation, explored some of these issues here and offered a somewhat lower total. You could be more radical, for example, by look at the investment stocks (bars, coins and ETFs). This would reduce global above-ground stocks to 42,400t. If you added in central banks and OTC investment you would be nearer to 80,000t.
The risk here is in excluding too much. Jewellery does come back to the market and in response to price signals – especially high-carat jewellery in places like India. My alternative suggestion is that you weight each category of gold stocks in terms of how liquid they are. The idea would be that if, say, gold jewellery is being melted down and turned into bars, the global gold stock is becoming more liquid. If gold bars are being melted down and turned into jewellery, it is becoming more liquid.
Something similar happens to measures of the money supply, where the difficulty historically has been whether you should look at cash, or cash and current account, or those and savings accounts and so on (M0, M1 etc). The Divisia measure deals with this by aggregating them according to how much they provide transaction services, and its proxy for this is the relative interest rates on each type.
Unfortunately in gold we don’t have an interest rate to do that. And this is where it gets tricky. The question is how easily such gold can return to market. One measure could therefore be the cost of transforming the product into London Good Delivery metal. For ETFs this is almost zero. For bars and coins it is relatively small. For jewellery it is higher. But it doesn’t quite measure what we want. After all the cost of transforming low caratage western jewellery presumably isn’t much higher than high-carat jewellery, but it is less likely to happen as the western jewellery has higher value-added elsewhere. So possibly a better measure is gold as a % of the items value – near 100% for investment gold, quite low for western jewellery and industrial gold.
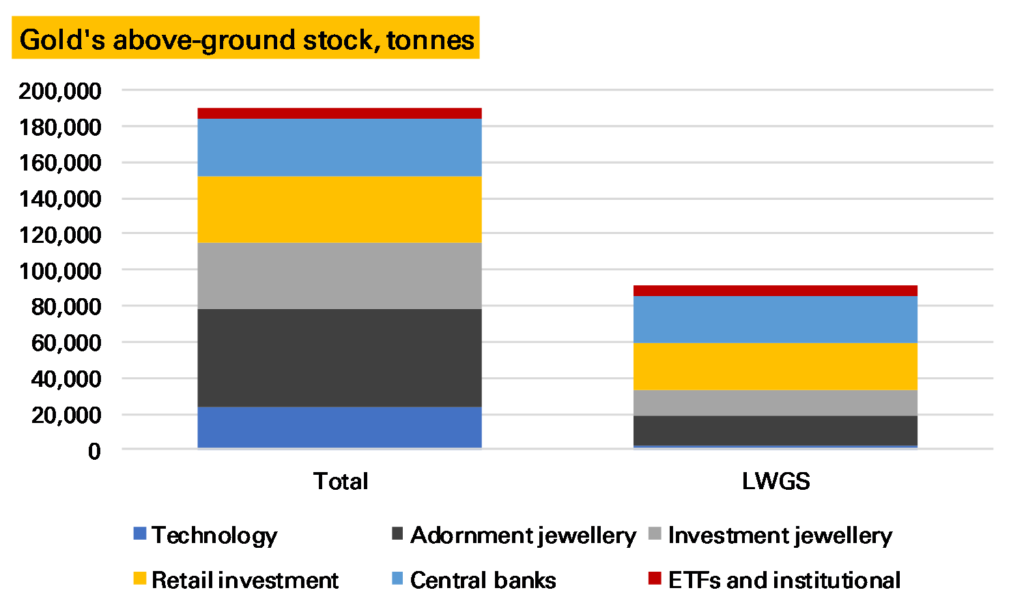
Calculating neither of these will be easy. And so I’m just going to give some guesses. I’m going to weight ETF and institutional gold holdings at 1, retail investment at 0.7, high-carat investment jewellery at 0.5, western-style jewellery at 0.3 (note I’ve made some assumptions about the split between these) and other fabricated products at 0.1. Central banks is a tricky one – they hold mostly London Good Delivery Gold, so highly liquid, but there is a lot institutional stasis preventing both buying and selling. I think the former wins out – so I’ll go for 0.8 – but I could see good reasons for a much lower figure.
Applying these weights to the current 191,000t of actual above-ground stocks gives a a weighted figure of 91,000t (which I’ll call, slightly inaccurately, the liquidity-weighted gold stock, LWGS), made up of 2,400t of other fabricated stocks, 16,500t of adornment jewellery, 14,700t of high carat investment jewellery, 25,400t of bars/coins, 26,000t of central bank gold and finally 6,100t of ETFs and other institutional stocks.
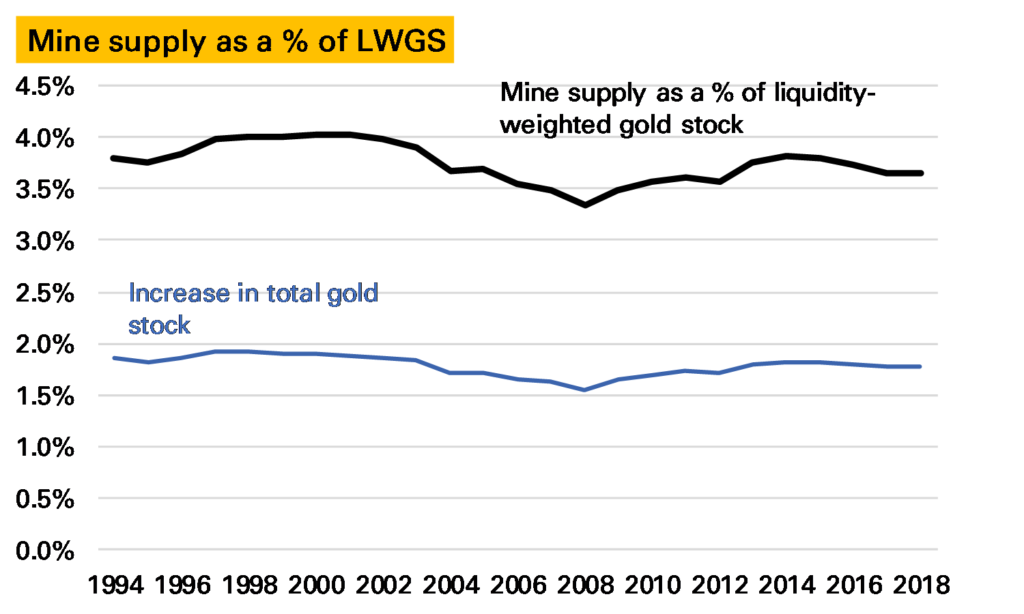
Does this aid analysis? Obviously it means for a given size of gold move the market will have a harder time absorbing it. New mine supply every year represents about 3-4% of this weighted gold stock compared to 1.5-2% of the total gold stock.
Of course while new mine supply needs to be absorbed, it is no longer an indication of how much the gold stock is growing by. That which is diverted into technological uses, for instance, doesn’t add at all much on my measure.
The annual increase in the liquidity-weighted gold stock looks like this.
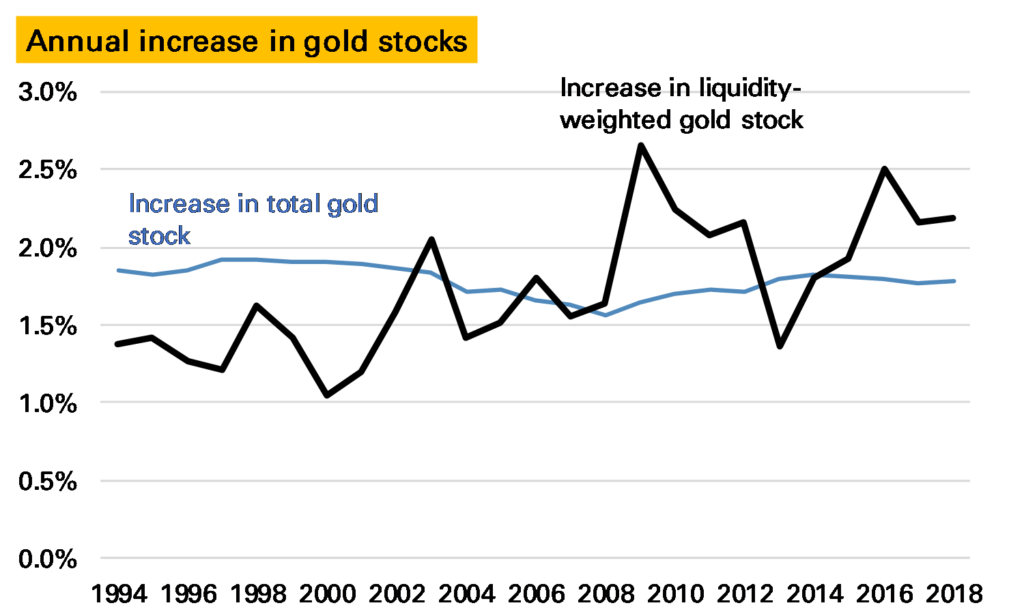
We can see that in the 1990s the global LWGS grew less slowly than the total gold stock (or put another way the total gold stock was becoming less liquid), a function largely of liquid central bank gold being sold and converted into less liquid Asian jewellery. But starting in 2001, and gradually building up to 2009, the annual increase in this liquidity-weighted gold stock accelerated as this process reversed, with a splurge of investor buying. Since the the liquidity-weighted gold stock has continued to grow proportionally faster than the total gold stock, with the exception of 2013, when a wave of ETF selling saw liquid gold melted down and converted into less-liquid jewellery into China.
Notes:
- Note all the charts in this piece are based on GFMS Refinitiv supply/demand data, with historical data from the USGS ↩
- The only slightly comparable commodity would be silver – see here for a new look at its inventory ↩
- A similar argument can be made if gold demand was to fall by 1,000t suddenly – in theory investors should rush in from other assets – in practice I think the price would fall substantially ↩
- And it oddly hasn’t changed in nearly two decades, I think ↩
- Compared to the total stock these breakdowns are evidently more open to error ↩
- I’m a bit puzzled what this is, to be honest. The bulk of industrial demand is electronics, at around 300t a year, which would account for this but surely much of that is thrown away or recycled? ↩
Re estimation of stocks, I think it is more likely to be understated rather than overstated as the privacy aspects of gold mean people would be reluctant to report gold mined or acquired. In modern times it is a lot harder for corporate mines to avoid reporting but earlier times how accurate are estimates of gold mined?
Ultimately the issue of stocks is about how likely are the holders to sell. The liquidity weighting is one method but I think the propensity to sell is reflexive – it depends on the price.
Saying “western-style jewellery at 0.3” is another way of saying at current price range, how likely is that type of gold to be sold. That is, if you surveyed people with that question then 30% of western jewellery holders might consider selling. But if you asked them would they sell their jewellery if the price was $10,000 I bet the answer would be 100%.
Ideally you want to build up a bid/offer stack – the survey question is “at what price would you sell your gold” – everyone has a point at which they would sell and that theoretical stack of offers is the real measure of liquidity or stock/flow propensity.
I’m sceptical of the stocks being overstated by much simply because so much has come in the last 25 years, when data has been good. I also wonder about the loss estimates, though with no real conviction. I agree there is a price at which any holder would sell – related to the value-added point – and agree a bid-offer stack would probably come closest to an accurate description of reality. What I want is to show how flows between the stocks – in particular this shift from melting down bars for jewellery to jewellery for bars has changes the market. I guess in your stack suggestion the idea would be that the price at which the holders are willing to sell falls if it shifts from jewellery to bars. The problem I have (also a problem with my method) is that actually in the example the holder of jewellery has sold, so whatever their propensity to sell it was by definition lower than the bar holder. So I don’t think it captures the dynamics correctly.
Thank you very much for the comment Bron, appreciated. I think the first here that wasn’t peddling medicinal products.
I agree. In the end gold supply is just a matter of the position of the supply curve and its shape. Liquidity “problems” play in as a steepening of the tail end of the curve no?
I just wrote a post that relates to this topic. https://www.voimagold.com/insight/the-essence-of-gold-supply-and-demand-dynamics
Yes I saw and agree with a lot of it. I liked this bit especially:
Gold’s supply-side consist mainly of inventory (a high stock to flow ratio). And, because virtually everyone buys gold as a store of value, and gold is hardly ever used up, the demand side consists mainly of inventory as well.
But I’m not sure I agree with it! I think mine supply and jewellery supply are the dominant factors in the gold market. I will try to think how to explain it..!
In my view, gold being a currency, every gold trade has the same impact on the price. It doesn’t matter if one buys 1 ton of jewelry or 1 ton in London. All the same.
For me, every gold trade is just part of gold’s total trading volume. These GFMS balances are just a tiny part of all trading volume. Of course, the price is set where the most gold is traded.
And, If jewelry demand would drive the price of gold, how come jewelry demand goes down when the price goes up? https://www.zerohedge.com/s3/files/inline-images/Gold%20Mine%20Supply%20%26%20Jewelry%20Demand%20vs%20Gold%20Price.png?itok=fq9F0l0H
On the second point a classical demand curve slopes downwards but it is clearly setting the price (where it meets supply)?