No evidence of substitution away from palladium. Indeed evidence of no substitution

The palladium price has hit a new record high in recent days over $1,700/oz, and the FT has declared there’s more to come unless we see a global recession or substitution of much cheaper platinum. I agree. And yet at present not only is there no evidence of substitution but there’s evidence that there has been no substitution.

It comes from North Macedonia.

This country had little to do with the global PGM markets for much of its history. It is not a producer, and in 2009 reported imports of unwrought PGMs of only $1. That might sound a little implausible, but probably not far from correct – in 2008 PGM imports were less than $20,000.

And yet in 2010 it imported over $100m of PGMs. And by 2018 this was over $1bn, with more than 1 Moz of PGMs imported. This year is approaching $1.5bn.
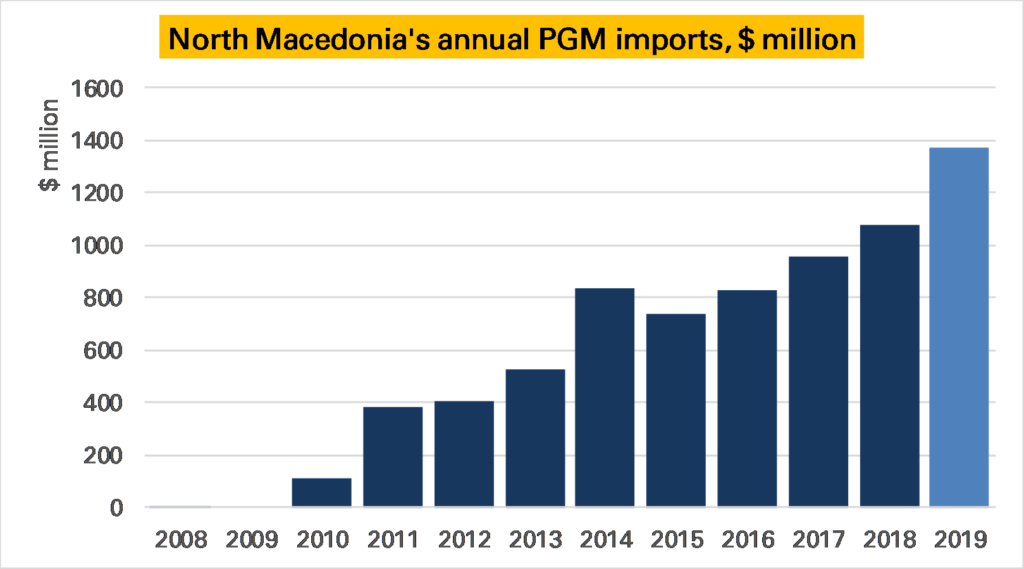
Source: UN comtrade, Matthew Turner. Note 2019 extrapolated from first 7 months of the year.

What gives? In 2010 refiner Johnson Matthey (JM) opened a diesel autocatalyst plant, which was expanded in 2013. This is why North Macedonia’s exports of catalysts also exploded, rising from nothing in 2008/2009 to nearly $2bn in 2018 (Macedonia has not gone its own car industry).
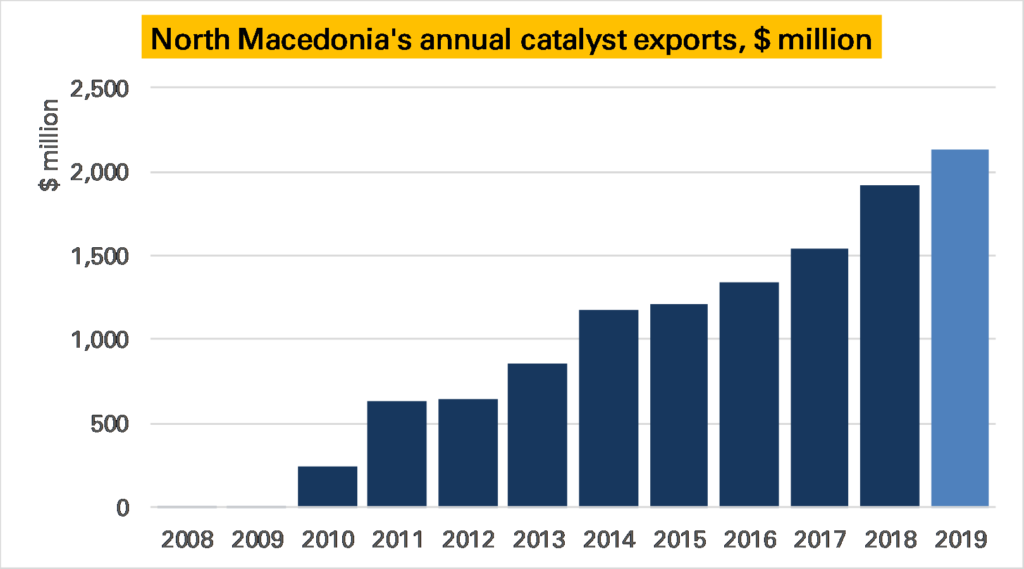
Source: UN comtrade, Matthew Turner. Note 2019 extrapolated from first 7 months of the year.

This is great for an analyst. Other large catalyst manufacturing countries are also PGM traders, such as the UK, and/or jewellery consumers, such as the China and the USA. This means it is hard to draw firm conclusions from trade data. But in North Macedonia it is just catalysts – therefore it is safe to assume the imported PGMs are being used in that sector.

As such because we can break the trade data out by metal we can use it to estimate what proportions of platinum and palladium JM are putting in their catalysts. If we look at its imports by volume, we see that more platinum is imported than palladium – in 2018 nearly 800 koz of the former to around 350 koz of the latter – making palladium 28% of the combined volume to platinum’s 72%. This is to be expected given the plant is producing diesel catalysts. But importantly this proportion of palladium in the mix doesn’t seem to have fallen in the last few years – indeed it modestly rose from 24% in 2015*.
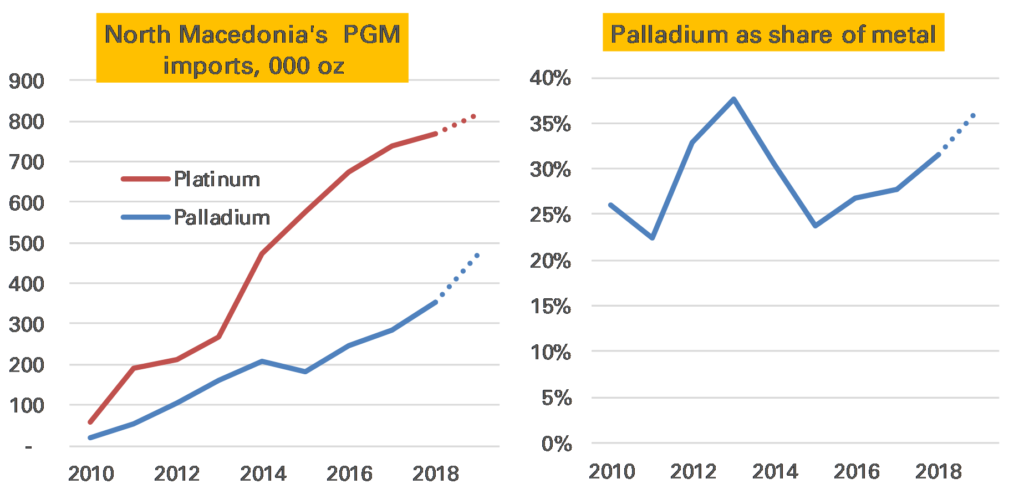
Source: UN comtrade, Matthew Turner. Note 2019 extrapolated from first 8 months of the year. This chart was corrected on 23-10-2019 as date axis misaligned and so includes August data.

Perhaps the shift has only happened in the last few months? Not that either. Indeed while monthly import data is quite volatile, if there is a clear trend it is the other way, with palladium seeing a share of 50% in one month.
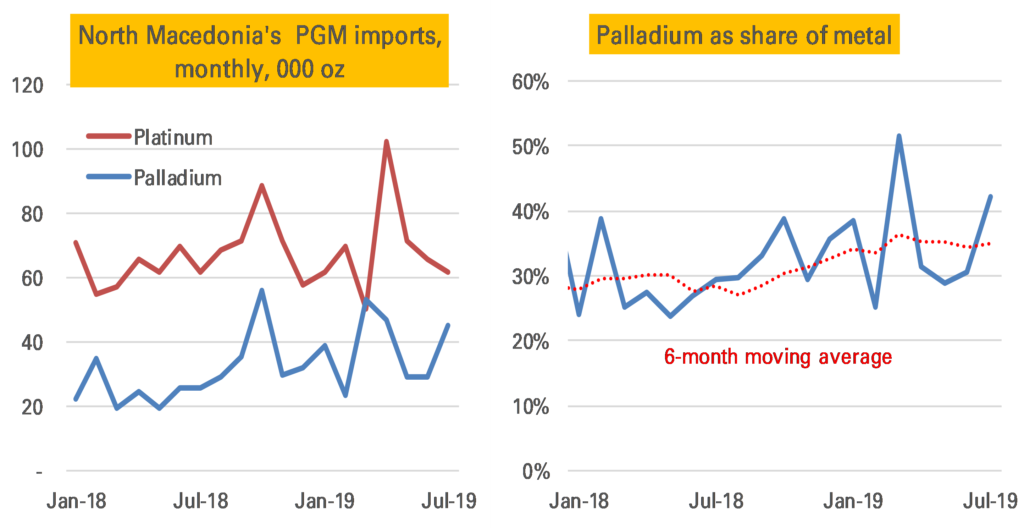
Note: The right-hand chart on 24-10-2019 replaced an earlier one which in error showed palladium relative to platinum, not as a share of all metal.

This data can’t prove no substitution is taking place. There could be other effects masking it, for example if JM have been importing additional palladium than they are using in catalysts (indeed it looks likely), perhaps ahead of the rising price or Brexit. It also might be that the mix of heavy and light vehicle autocatalyst could have changed, affecting the ratio (that’s what seems to have driven palladium’s share down in 2013 after the plant’s first expansion). And if the plant had begun manufacturing gasoline catalysts all bets would be off, though then we would also see rhodium imports, and we have not.

We also can’t assume that JM’s Macedonia plant is representative of all their catalyst plants or those of other catalyst manufacturers. And it is possible substitution is happening in gasoline catalysts, not diesel ones.

Nevertheless it is strong evidence that there has been no substitution. After all most analysts believe if substitution is to come it would come first in diesel, where car and catalyst makers are most comfortable with using platinum.

The palladium price could be going higher yet.
CBGA ends amid a changing world of official sector gold

Today marks the last day of the European central bank gold agreement (CBGA).

Announced on September 27 1999, and renewed at five-year intervals up to 2014, this was often described as a pact to limit central bank gold sales and lending, though arguably its main role was to improve market conditions sufficiently to give space for hefty European sales. From around the mid-2000s European central banks lost interest in selling gold, and as such the pact became rather pointless, the main reason why in 2019 it wasn’t renewed.

Central bank’s attitudes to gold have changed significantly since 1999. Back then global central bank gold holdings still largely reflected the relative economic strengths of countries at the end of Bretton Woods era (1970s). 85% of the world’s 30,300 tonnes of official gold (excluding that held by the IMF & BIS) was owned by the “Advanced Economies”, and almost all of that, 80% of the world, by the USA and Western European countries.

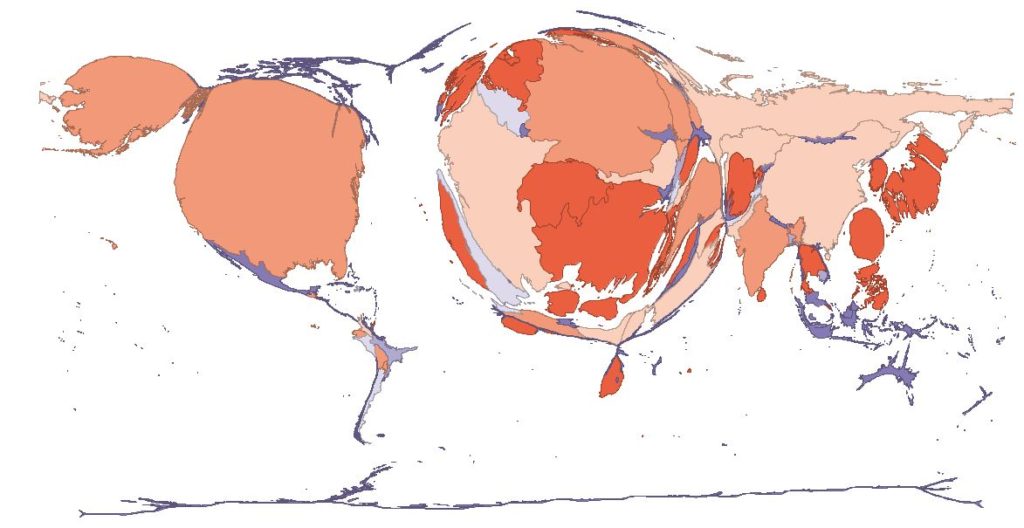
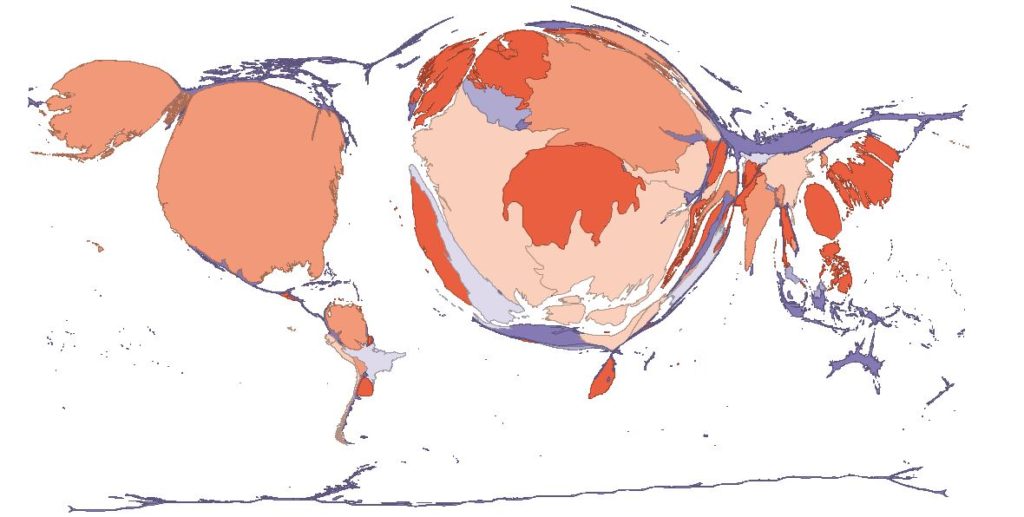
This geographical skew can be seen clearly in the following map, where I’ve resized the countries of the world by their official gold holdings – shows this clearly (ignore the colours)

Central bank gold holdings by country, September 1999 (source: IMF, Matthew Turner)

Fast forward 20 years and a map redrawn to reflect August 2019 gold holdings and at first glance nothing much has changed – the USA and Western Europe still dominate, even if the latter is somewhat smaller.

But look a little more closely and now Russia and Asia are far more visible.

Central bank gold holdings by country as of August 2019 (source: IMF, Matthew Turner)

This is because there has been a slow shift since the first CBGA was signed in 1999. The “Advanced economies” have sold nearly 4,000t, mainly through the CBGA – with gold holdings in the Eurozone down nearly 1,800t, in Switzerland 1,580t, and in the UK over 300t. Their share is now 70%, down from 85% in 1999. But globally gold held by central banks is up around 1,000t – because “Emerging and developing” economies have added nearly 5,000t. Russia and other CIS countries have been at the forefront of this, but China has also increased its reserves dramatically, and so have a reasonably wide range of other countries, including India, Mexico, and Thailand.

This shift is likely to continue. Certainly central banks are still buying, as noted in Tuesday’s post, with 1H 2019 seeing a record amount. This trend has many drivers but a slow – very slow – loss of faith in the US dollar seems behind some of it, not just in Russia. We’ve not seen any evidence of European selling resuming, indeed the main activity there purchases this year and last by Hungary and Poland. However I would think in another 20 years Western European gold holdings will be lower than they are today.

August: central banks keep buying gold but some signs of fatigue

One of the reasons to have been bullish gold over the past 12 months was an apparent step-change in central bank purchases. Not just were traditional buyers such as Russia and China continuing to add to their holdings, but new names were getting involved, including – gasp! – even European central banks.

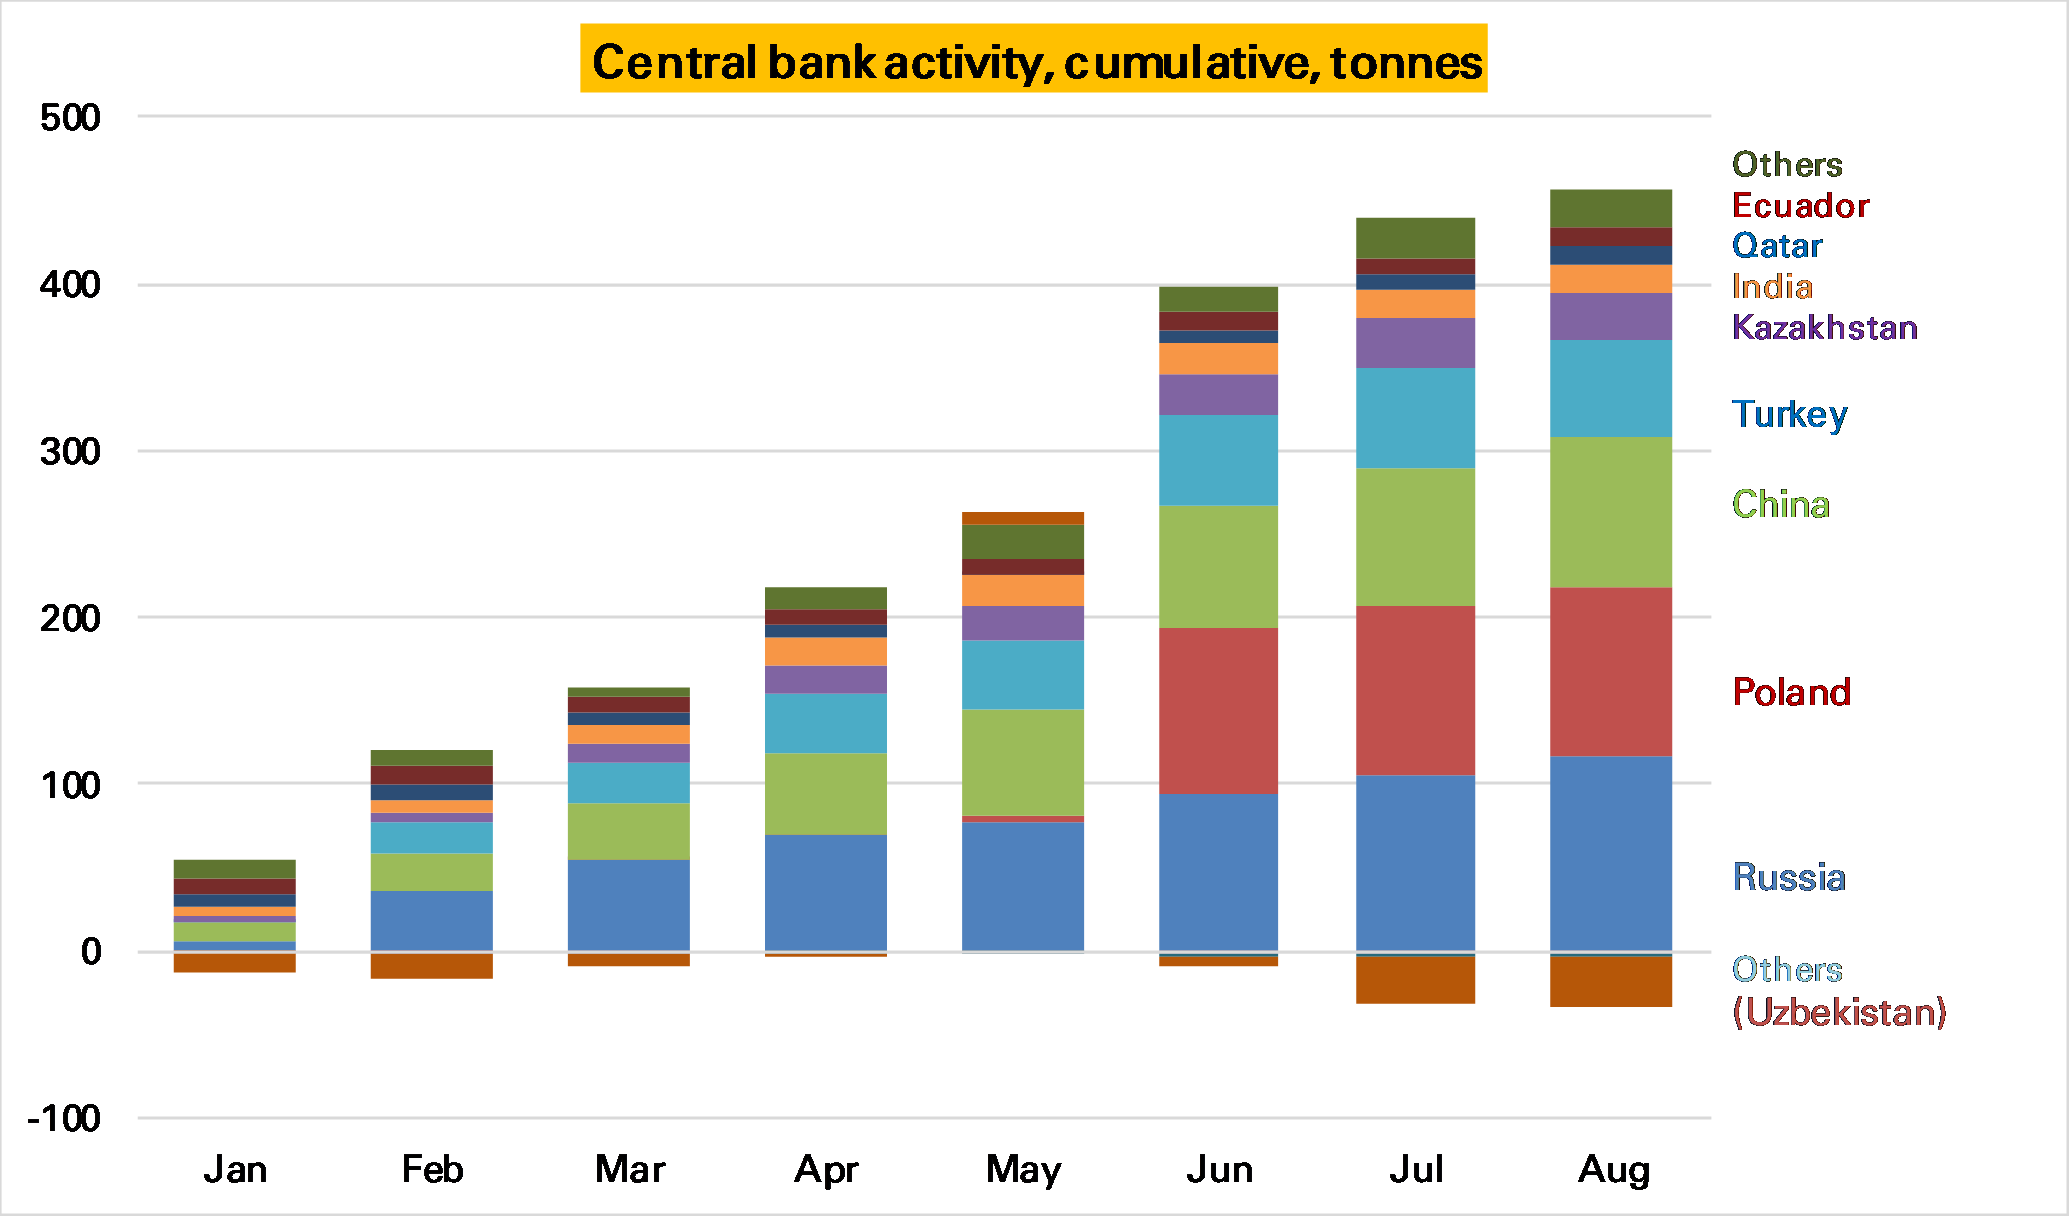
But after a tremendous 1H, in which net purchases reached nearly 400t, or 65t/month, there does seem to have been a slowdown in recent months. From latest IMF data (and direct central bank publications where necessary) I estimate 22t was purchased in July, and just 16t in August. The YTD total is now 423t.

It is likely these numbers are revised higher. Many countries report late, and given a general bias towards purchases this should mean more to come. In particular Turkey, which has added roughly 9t/month this year, hasn’t yet reported for August. Furthermore central bank gold buying has always been lumpy, for example Poland’s 100t purchase this year mostly in June, and so you do get quiet months.

Nevertheless even those buyers who were buying bought less, with just 11t from Russia and 6t from China in August. Furthermore Uzbekistan has sold quite heavily in recent months. The very high gold price, particular in non US dollar currencies, is perhaps having an effect.

Investment experts – as of 1964

The Golden Eggheads

Fascinating BBC documentary from 1964 about the state of the art in investment advice. It starts off in a gold vault but soon expands to cover technical analysis, Professor RF Kahn (of multiiplier fame), an M&A Boutique and some leading fund managers of the day.

The narrator seems close to saying it is all guesswork at times. How things change.

Weak Chinese gold imports nothing to worry about…for now

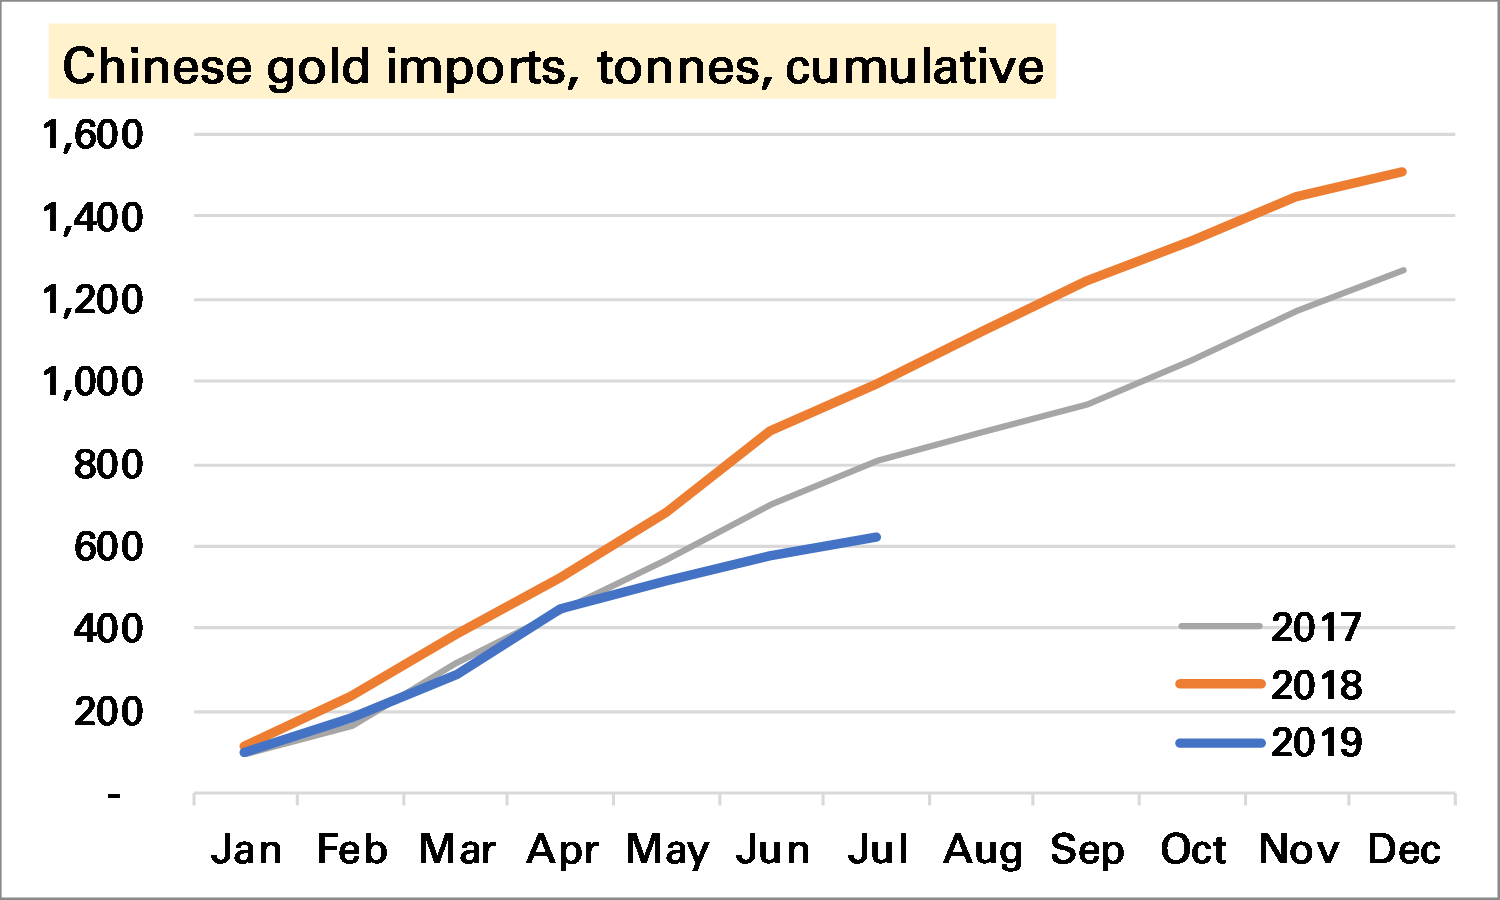
Chinese gold imports were weak again in July, 43t, and the YTD total is now just over 600t, compared to over 1,000t during the same period of 2018.

Is this something for the bulls to worry about? This Reuters story places the blame squarely on quotas restrictions aimed at restricting the outflow of Yuan. If correct this will be artificially suppressing gold demand, but history suggests such periods don’t last long. And it makes sense that if ETF investors are buying a lot of gold, the Chinese can’t have as much. That’s why the price rises. So it’s certainly not as concerning as it looks.

Nevertheless we must continue to pay attention to it. The biggest risk to the gold market medium-term, in my view, is lacklustre”physical” demand, of which over 50% comes from China and India. In particular it seems to me that gold – both as a consumer good and an investment good – now faces far more competitors (eg smartphones, index-linked bonds) than it once did. Of course some of its qualities are unique and it has a long track-record. But that might not be enough.

For the background on how China now publishes gold trade data see my LBMA Alchemist piece from earlier this year.