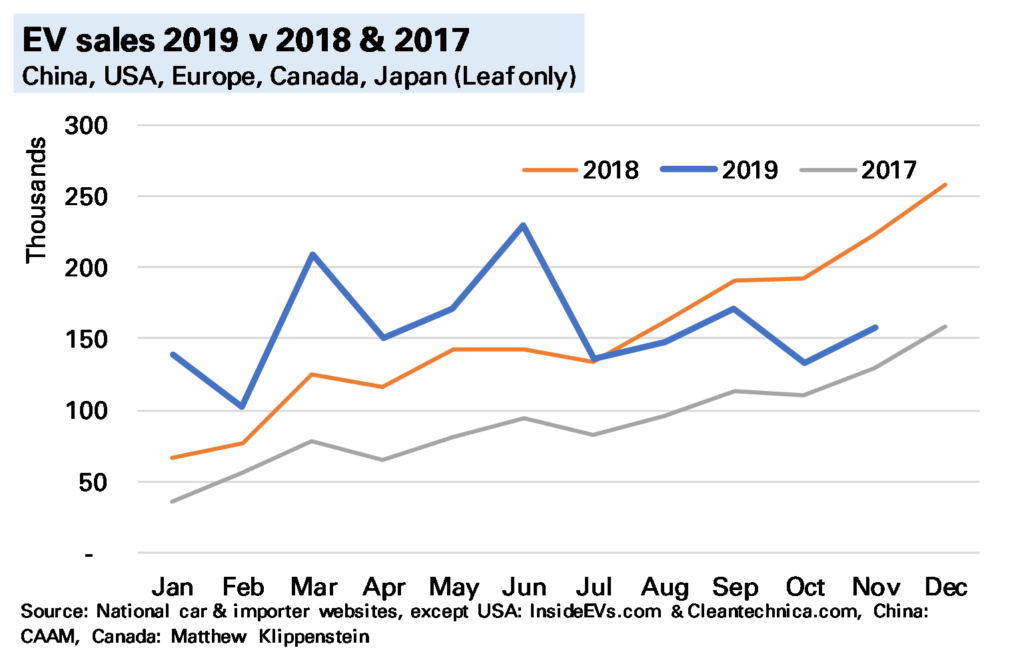
In November global electric vehicle (EV) 1 sales I estimate were about 160k, 29% lower YoY, continuing the slump seen in recent months.
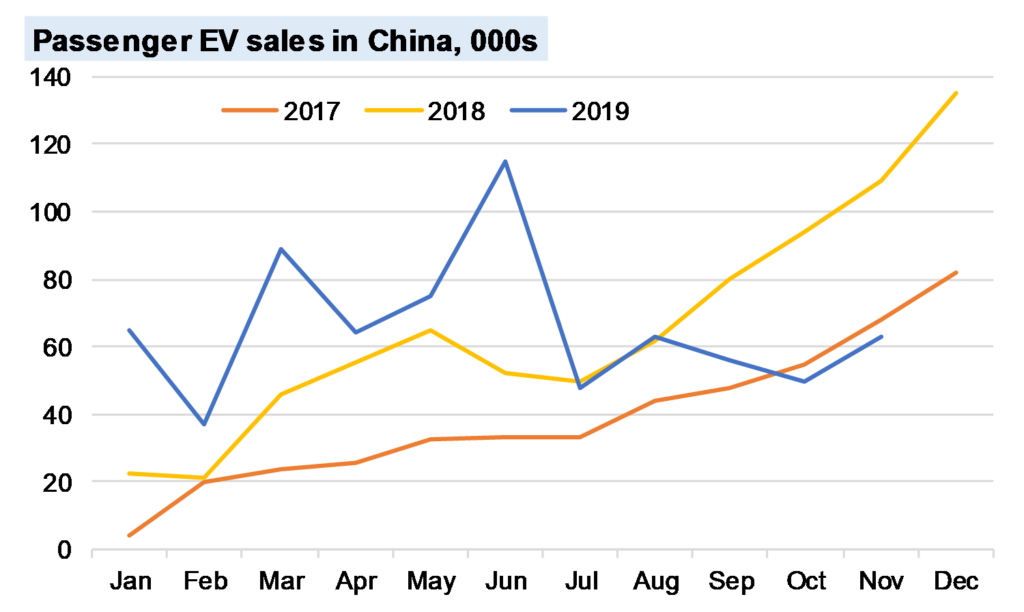
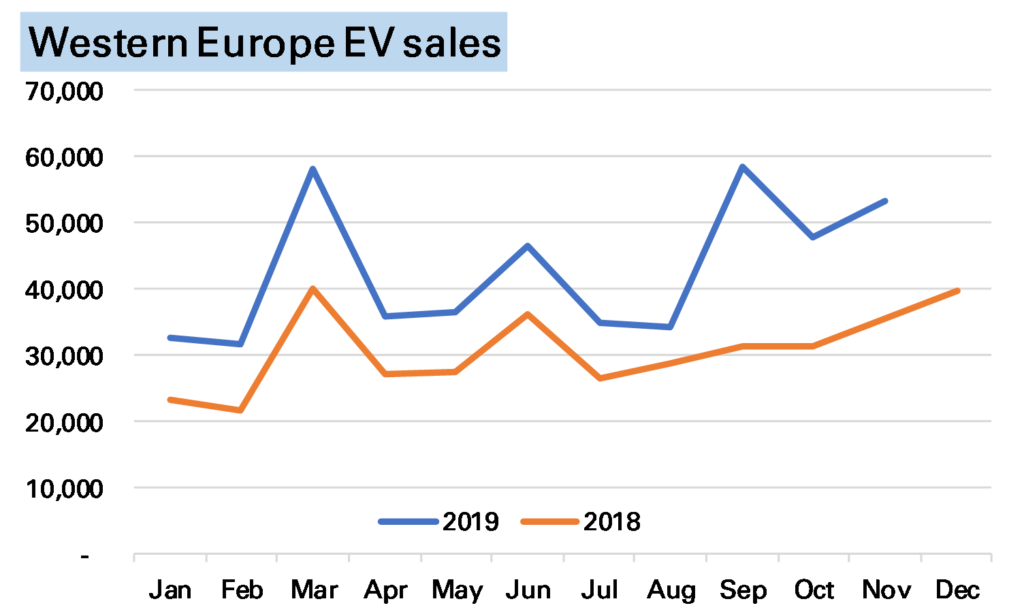
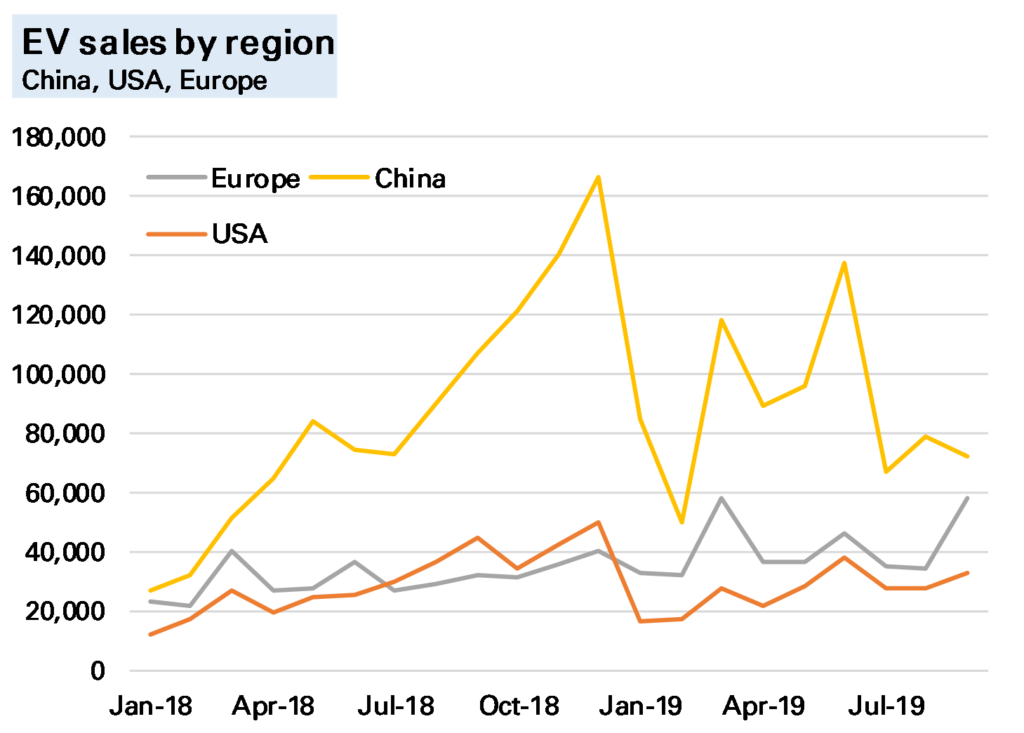
China accounts for most of the slowdown, being by far the largest market and down 45% YoY, little better than in October. Europe, on the other hand, while still a considerably smaller market, posted another solid growth rate of 49% YoY. The difference between the two markets is largely incentives – much lower in China since mid-year but remaining strong in Europe. The USA looks to be running somewhat lower than last year, though we await better data at year-end.
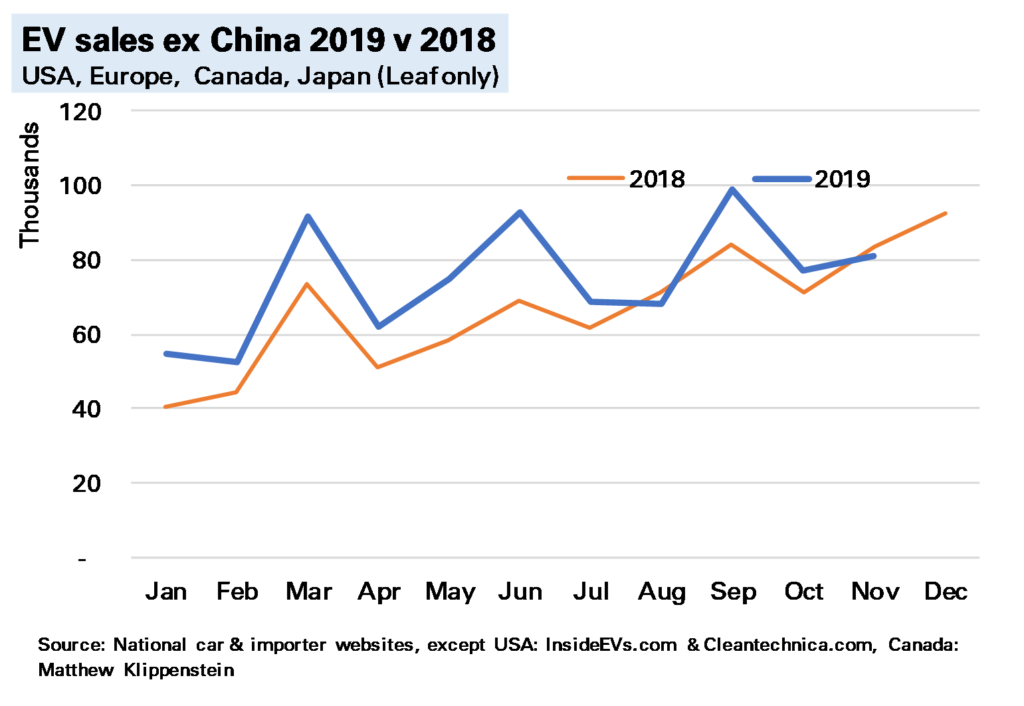
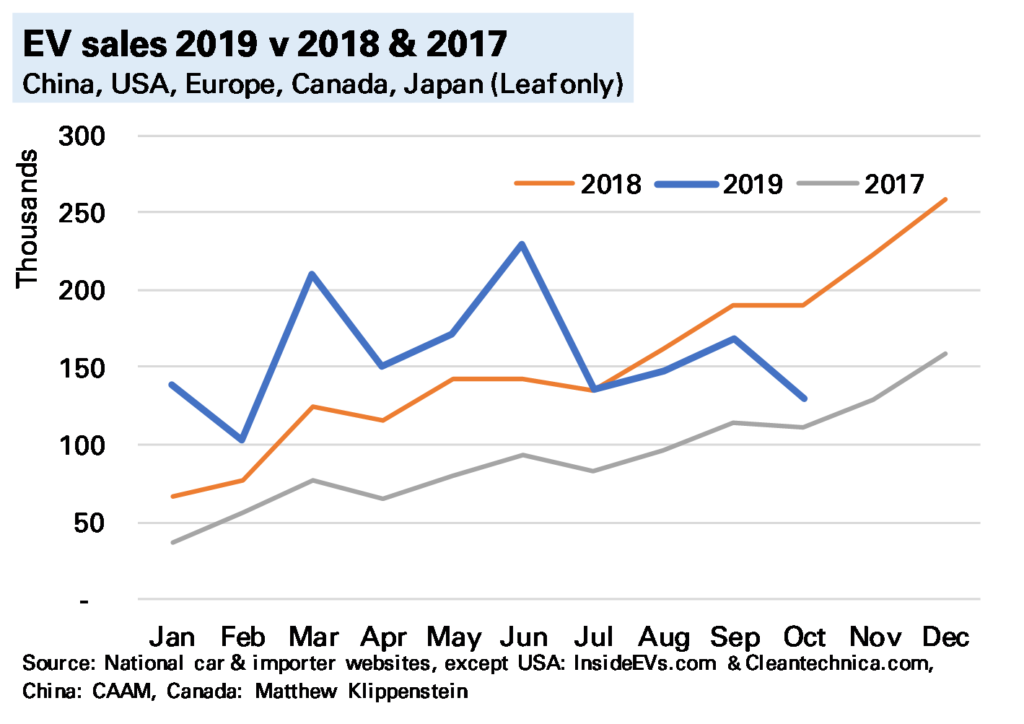
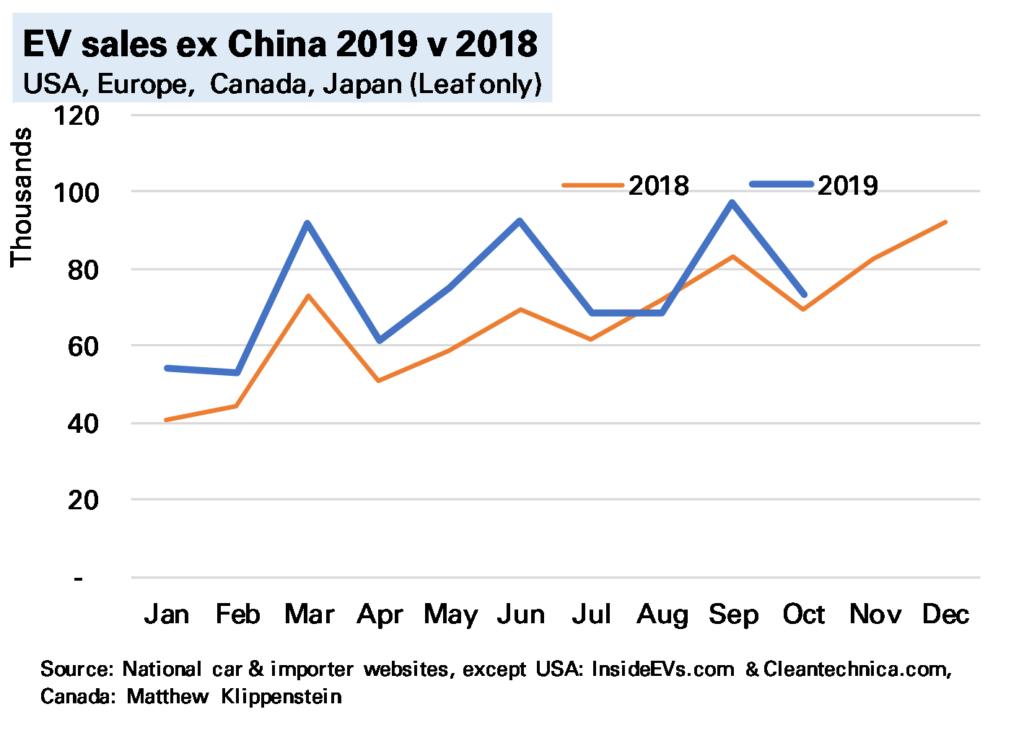
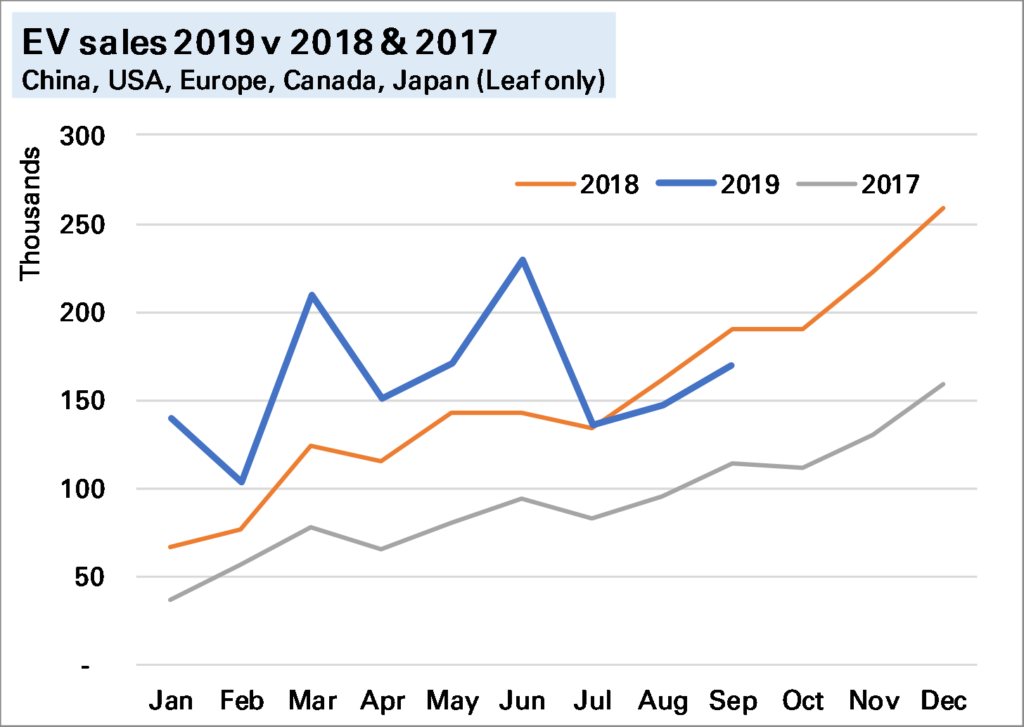
Overall, as the final chart shows, even excluding China, EV sales in November were no higher than in the same month of 2018.
(Note click on charts to show at full size)
With just one month to go it’s clear 2019 has been a disappointing year. Year-end is hard to predict but on current trends global EV sales are likely to be just under 2m, only 6% higher than in 2018. Chinese EV sales are likely to be flat or slightly down, as are US EV sales, while Europe will be up 40-50%. This will mean while China’s share of global EV 2 sales falls from 56% to just over 50%, Europe’s will have risen to 27% from 20%.
Notes:
China, USA, Europe, Japan Nissan Leaf. Exclude Chinese light commercial vehicles – another 10k or so – and perhaps another 10k vehicles in the rest of the world, most notably Korea ↩
Again this excludes the large – 130k or so in 2019 – Chinese commercial EV market ↩
A slump in Chinese electric vehicle (EV) sales drove global EV sales into reverse in October. I estimate, using national and other sources, that 130k EVs were sold during the month (140k if you include Chinese commercial vehicles), 32% lower YoY, with both battery-electric vehicles (BEVs) and plug-in hybrids (PHEVs) down a similar amount.
The sharp global YoY fall is partly because in previous years sales have risen into year-end on a combination of beating expiring incentives and a generally rising market. But sales last month were also lower MoM, and while this owes something to wider market trends, it is mostly due to China.
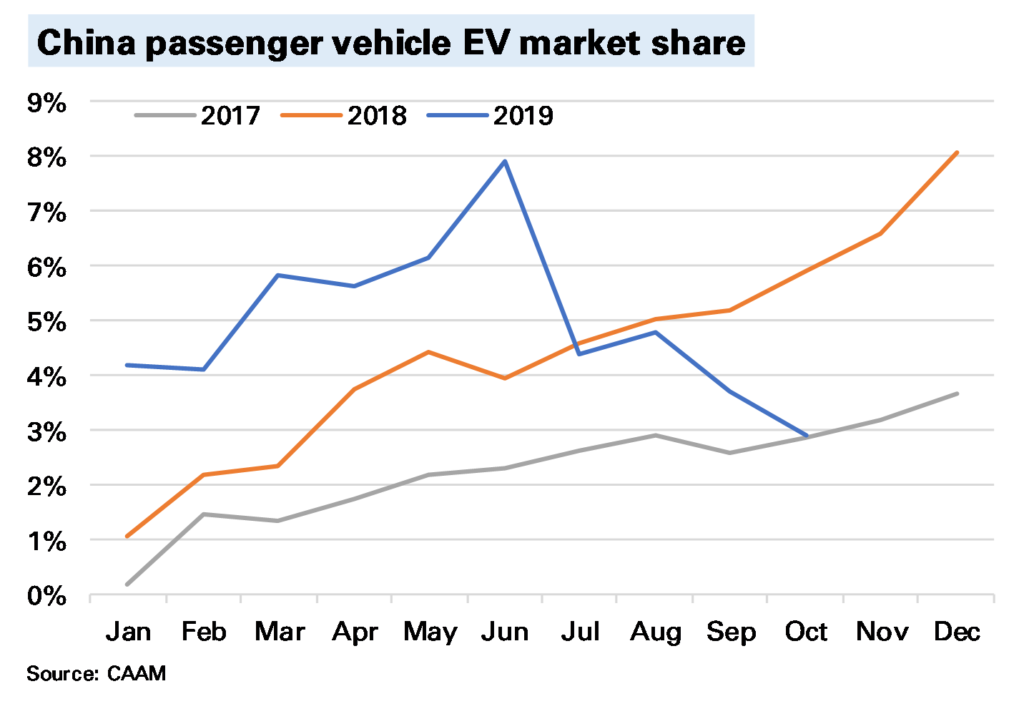
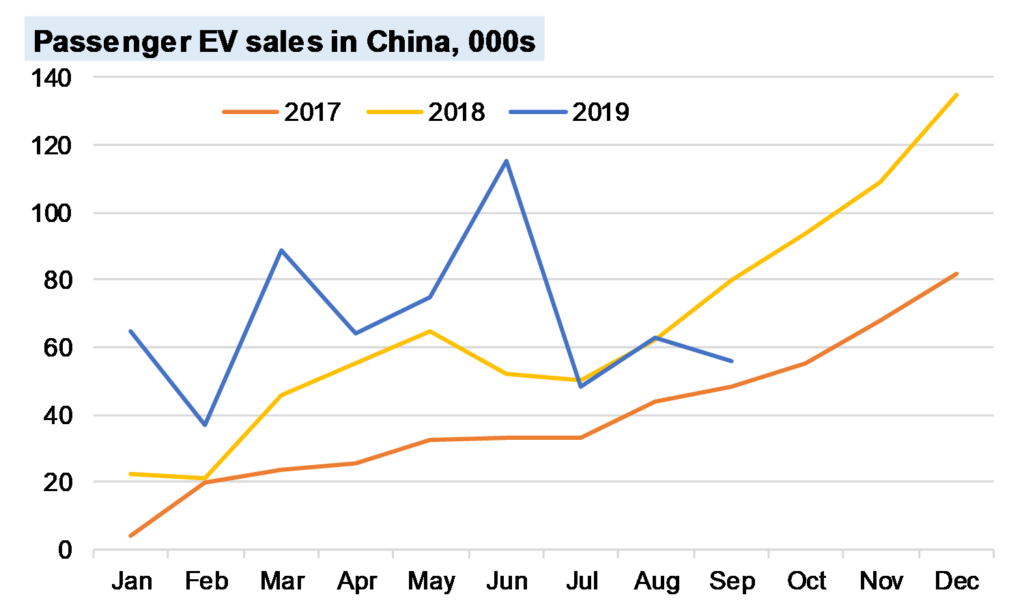
In China, which accounted for 64% of global EV sales in October 2018, EV sales were 54% lower YoY, with BEVs down 47% and PHEVs down 78%. The following chart shows this is not primarily related to a weakening wider market (all passenger car sales were down, but a more modest 6%) but a sizeable fall in market share. The reasons for this we’ve discussed many times before, and are mostly subsidy-driven, though the extent of the slump does point to some consumer disenchantment. Sales for the full-year are now only 18% YoY higher YTD and could end the year lower than in 2018.
If we exclude China then global EV sales were still slightly higher YoY, though note not by much.
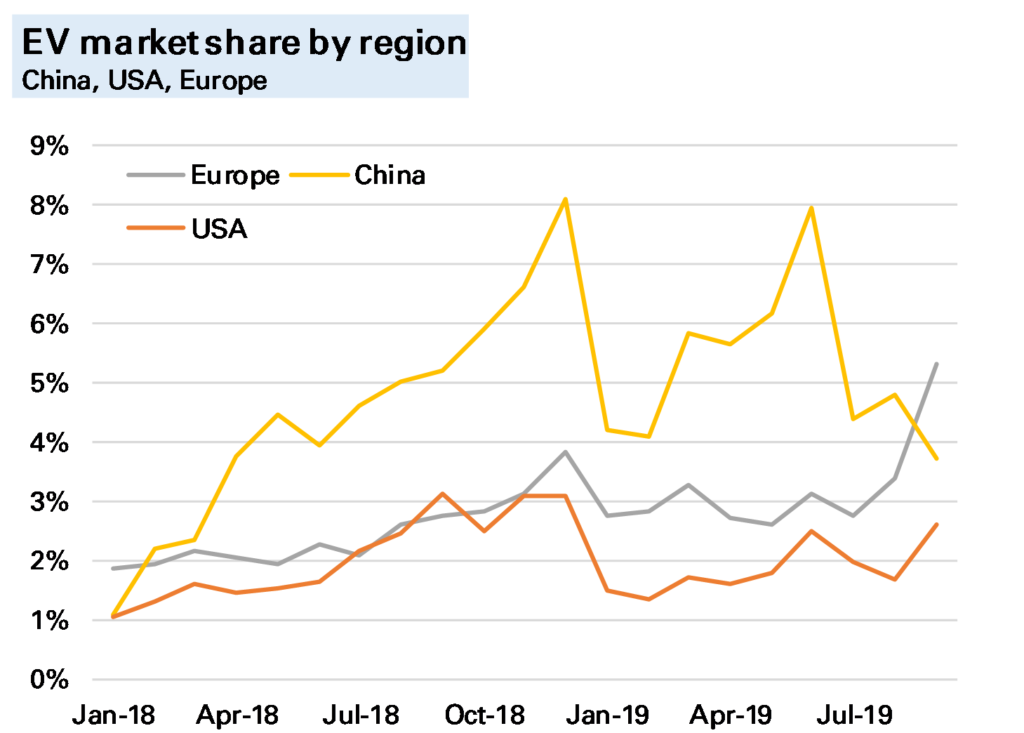
The only bright spot at present is Europe (see my earlier post), where sales were more than 50% higher YoY. And while total EV sales in Europe were still lower than China in October (48k to 56k) the gap has narrowed considerably, and in terms of market share of all car sales Europe has now been higher for two months. Of course this owes something to the Tesla Model 3 roll-out, which is likely to subside, but it does suggest the dominance of the Chinese market in sales is not as obvious as once seen (of course production & battery manufacturer are different questions).
I’ve not said much about the USA, and for two good reasons. One, sales seem subdued, with Tesla concentrating on foreign markets. Two, we are lacking accurate data. The sterling work done by sites such as www.insideevs.com and www.cleantechnica.com in assessing this continues, but a decision by most manufacturers to switch to quarterly data 1 means much monthly data is now guesswork, and for PHEVs I’ve had to make an extrapolation on previous trends. This won’t make a change to our global conclusions – the US does not have a big enough market – but it does mean we need to be cautious on assessing the micro-trends.
My view on the longer-term outlook remains the same. The current slump is a reminder that technological shifts are rarely smooth, and some of the reasons for it (subsidy-issues, consumer reluctance) also point to why EV roll-out will be slower than the more bullish predictions. But subsidies are not all one way – the German government recently announced more generous ones – and consumer reluctance will be overcome by a wider and better range of models. And 2020 still seems a crucial year for that.
Notes:
There is no national or govt tabulation as in many other countries ↩
While global EV sales were disappointing in September, down 11% YoY, those in Europe continue to soar, gaining 82% YoY. And while Europe remains far behind China in EVs sold YTD, at 369k cars, to 792k, in September the two markets were much nearer, at 58k to 72k. In market share, Europe was even a little higher than China, though I wouldn’t want to make too much of this, given I exclude from the totals some smaller EV markets where by definition market share is low.
Will this continue? It’s unlikely. Europe’s EV sales are rising, helped by subsidies and new model launches, though September is likely to prove exceptional given a backlog of Model 3 orders. And Chinese sales should improve into year-end, if not at the same pace as in previous years.
Source: National car data, Insideevs.com, Matthew Turner, October 2019
Globally 170,000 electric vehicles (EVs) were sold in September, 11% lower YoY, with pure EVs (BEVs) falling YoY for the first time. This I calculate using national data released in the last two weeks.
Regionally there was a very strong performance in Europe, where YoY sales were up 82% YoY (note revised from 75% in the linked article), boosted by pent-up sales of Tesla’s Model 3. However in the USA weakening sales of the Model 3 compared to its own, earlier, 2018 boost was a major factor in EV sales falling 26%.
But the biggest impact on the global numbers remains China, and there sales of EVs were very weak, down 34% YoY. With China accounting for around half of global EV sales in September 2018 (and still more than 40% in September 2019) this clearly dragged the global total down.
All Chinese car sales were down 6% YoY, but the slump in EV YoY is more due to reduced subsidies and perhaps some signs Chinese consumers are worrying about value for money, especially resale value. It’s also exacerbated by the strong start to the year and the exceptionally strong end-year performance seen in both 2018 and 2019, which seems missing this time around.
The advocacy of a four-day working week by the Labour Party’s shadow chancellor, John McDonnell prompted a commentator to say that the one bulwark against the Americanisation of the UK economy was that the British were a bunch of slackers, at least compared to the industrious Americans.
This got me thinking. We all know that Americans work longer hours – the OECD in 2018 puts the average working year at 1,768 hours, 15% higher than the British who put in 1,538 (incidentally about the same as in France; it’s Germany which has the really short hours at 1,363). This difference of 230 hours is about 5 hours extra per work, or the equivalent of about 7 weeks holiday untaken.
However, fewer Americans now work at all compared to the British. The employment rate, which measures what proportion of people of working age population are in fact working, is just 71.1% in the US, compared to 75.1% in the UK.
If we multiply hours worked by % working we should get the average hours worked per person of working age population. For the US this is 1,768 x 71.1%, or 1,257 hours a year. For the UK it is 1,538 x 75.1%, or 1,155 hours. So the Americans still have it, but by a narrower amount of 9%.
It might even be closer than that. It is hard to be sure definitions are the same between the two countries. If we look at total hours worked in the economy, in 2018 it was 254.6bn in the US and 54.0bn (1,038*52) in the UK. The number of adults in each country is quite hard to find out, but seems to be 253m in the US, and 52.5m in UK. This suggests a very similar number of hours per person over the age of 18* of 1,028 in the US and 1,006 in the UK.
I’m not sure why this gives a more similar figure than the other method. The main difference is it includes pensioners, but this should boost the US total (there are fewer of them, but they work more than in the UK) So it might be due to differences in definitions around ages, or something to do with the military.
Either way the Americans do still work longer hours than the Brits. But there isn’t much in it.
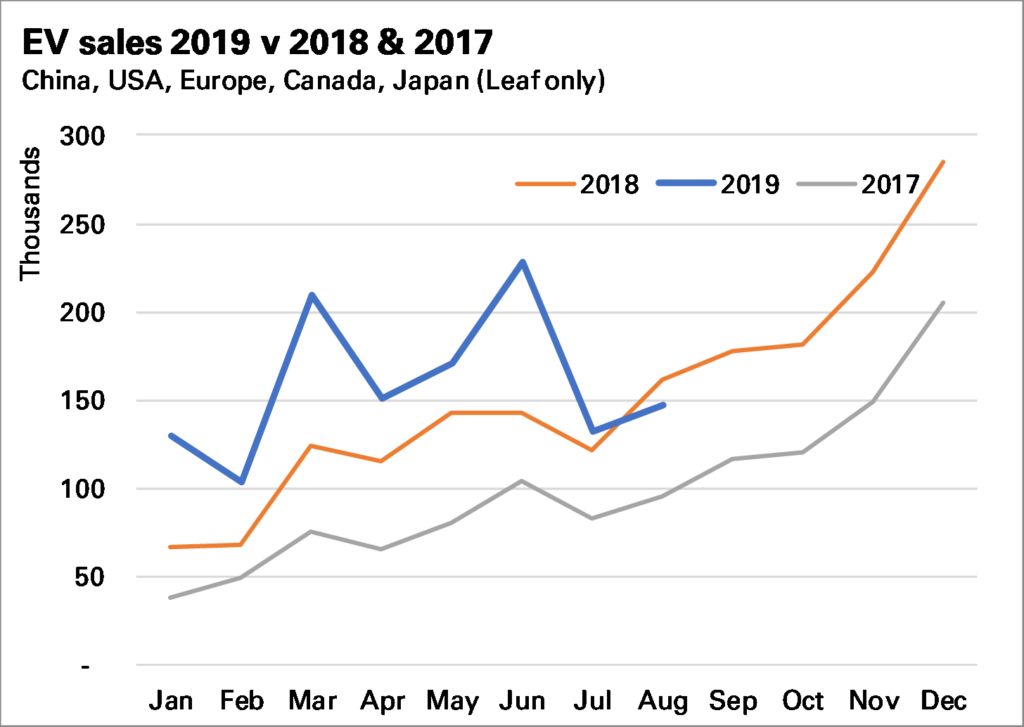
The impressive growth in global* electric vehicle sales came to an end in August, with a 9% YoY fall (updated from a 2% gain after the release of further data).
147k EVs were sold during the month: 111k battery-electric vehicles (BEVs), up 4% YoY, and 36k plug-in hybrid electric-vehicles PHEVs), down 34% YoY.
This slowdown in global sales growth can be attributed to:
A fall in China post subsidy changes (down 12% YoY in August), which had also brought forward some sales. This matters as China still accounts for more than half of all EV sales.
Slightly slowing growth in Europe (21% YoY in August) despite the Tesla Model 3 doing well, and, most important in August;
A fall in USA sales as Teslas are diverted to other markets (down 24% YoY in August). An important caveat here: US sales data has become harder to compile in recent months as automakers have revealed less information and (building on www.insideevs.com efforts) I’ve had to estimate some of the smaller selling models. However there’s no doubt sales were lower YoY.
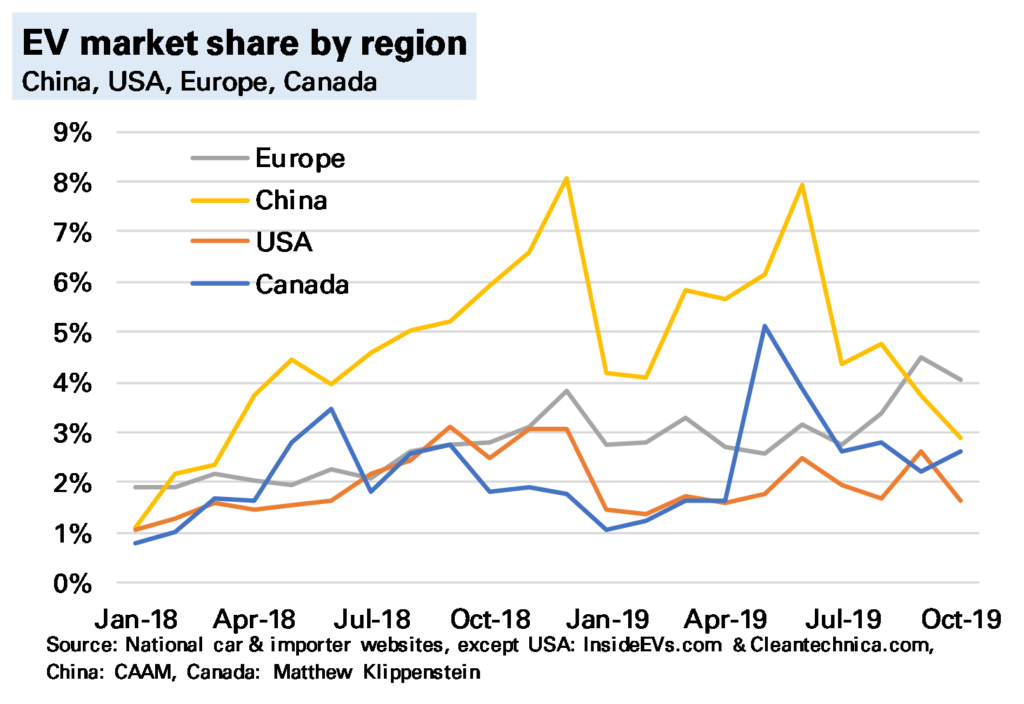
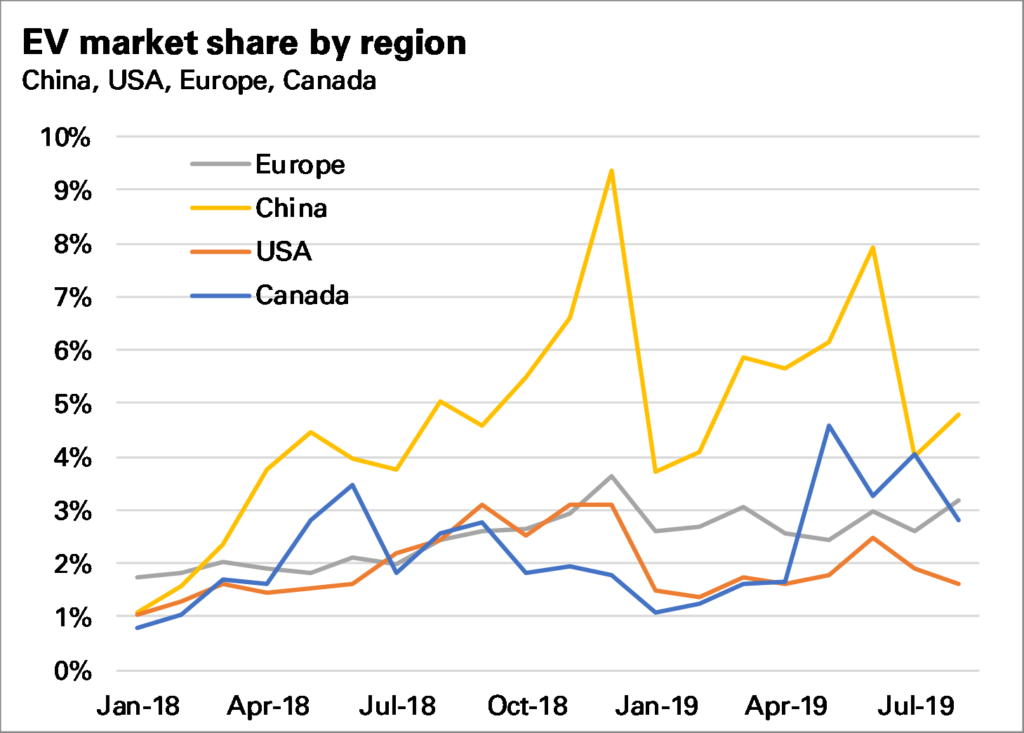
In terms of market share China remains ahead (though obviously some European states such as Norway are individually much higher). Canada’s share was boosted by high Model 3 sales. Europe’s continues to steadily rise, supported by generous subsidies.
Looking ahead, should the weak August numbers shift our longer-term expectations?
Yes, and no.
Yes because it seems unlikely 2019 global full year sales will be able to match some of the earlier targets. YTD sales remain 35% higher, but if sales growth is flat from now until December it would end the year up less than 20%. And it is always risky to ignore actual data: what this year’s ups and downs have shown is that the market remains rather niche: subsidy driven and dependent it on new models.
But no because while subsidies will continue to decline, new model launches are going to multiply. In particular lower cost EVs from established manufacturers, including the potentially game-changing VW ID3 (shown at this week’s Frankfurt motor show) will finally come on to the market in 2020. Ultimately this is what will drive EV market share higher.
Sources: USA – www.insideevs.com, Europe – national car & dealer associations, China – CAAM, Canada – Matthew Klippenstein. * Global = China, USA, Canada, Europe and Japan (Leaf only).