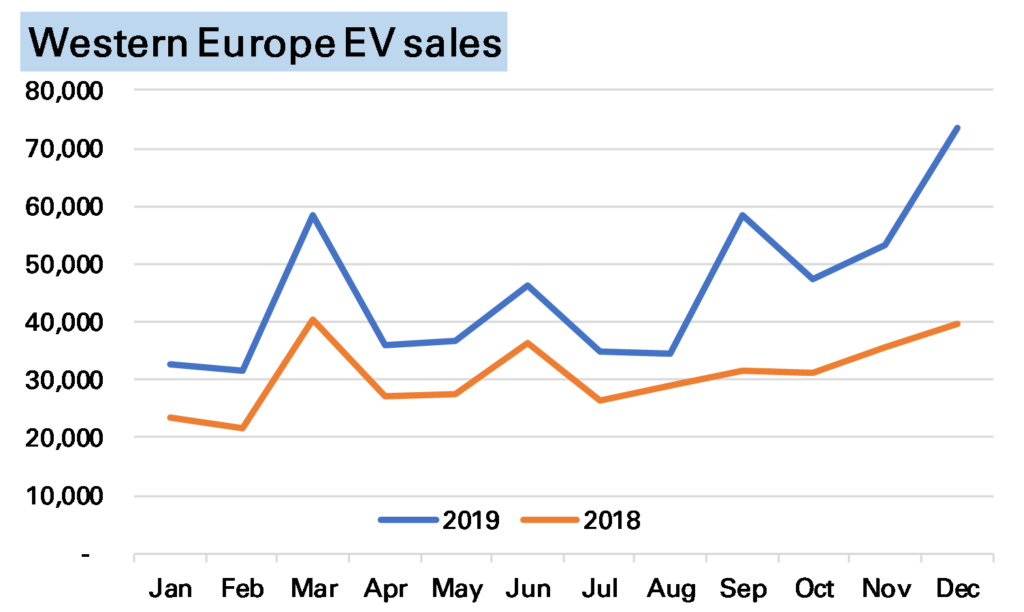
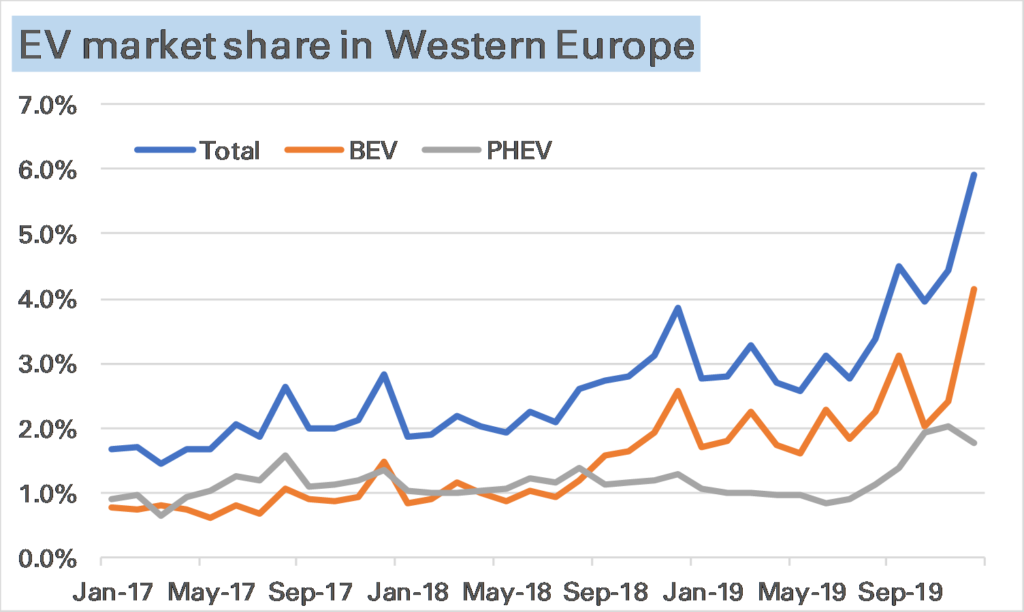
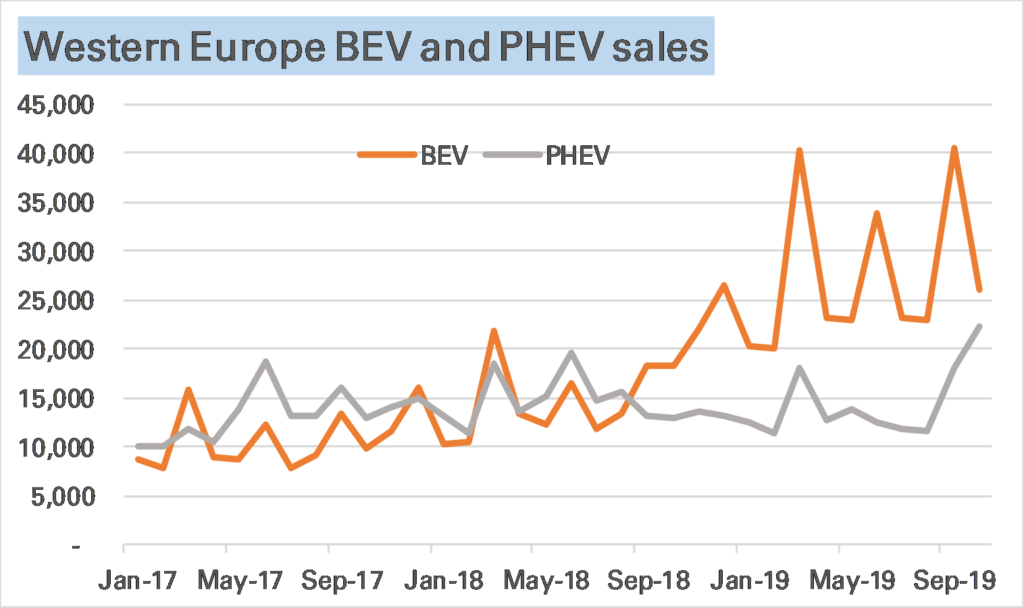
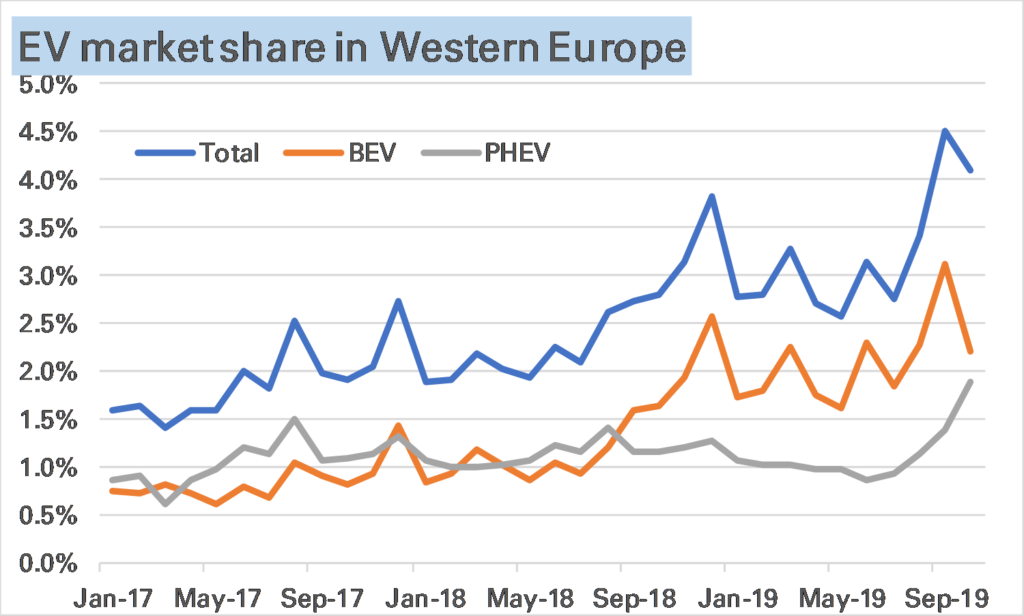
European electric car sales in December set a new record, at an estimated 74k units, a huge 85% higher than in December 2018. Market share, as shown in the 2nd chart, was nearly 6%, primarily made up of pure battery-electric vehicle (BEVs), up 94% YoY, while plug-in hybrids (PHEVs) were up 68% YoY but slightly down on November’s level.
Source (this and other charts): European national car associations.
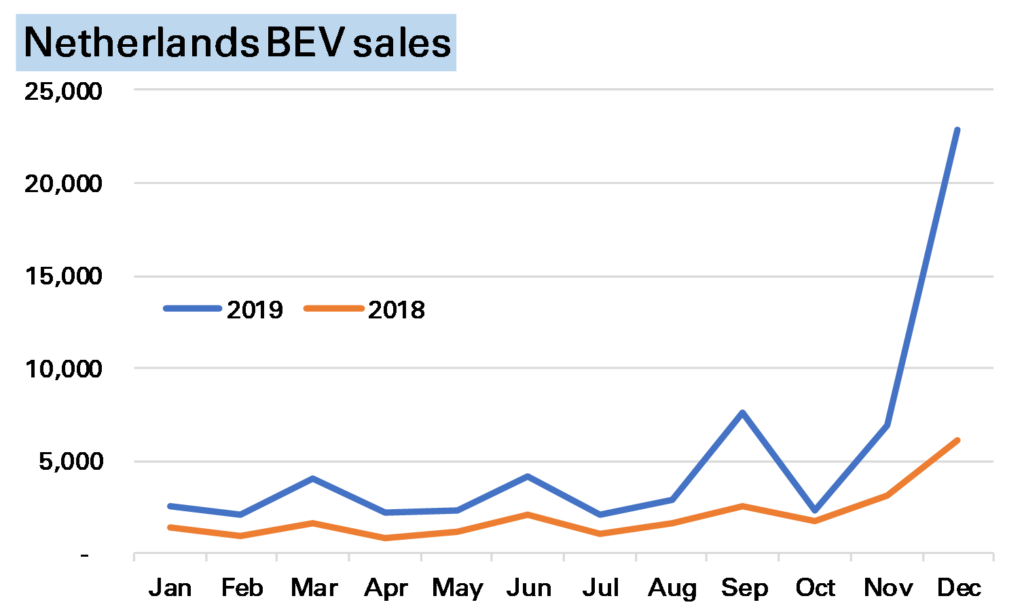
While European EV sales have been strong all year, December’s surge is somewhat misleading as to the underlying strength of the market. End-year can often see odd movements in EV sales as the market remains dominated by subsidies which often expire at that time. The most notable example this month was in the Netherlands, where higher taxes in 2020 brought forward purchases, seeing EVs take more than 50% market share and BEVs on their own sell nearly 25,000 units, a third of the European market.
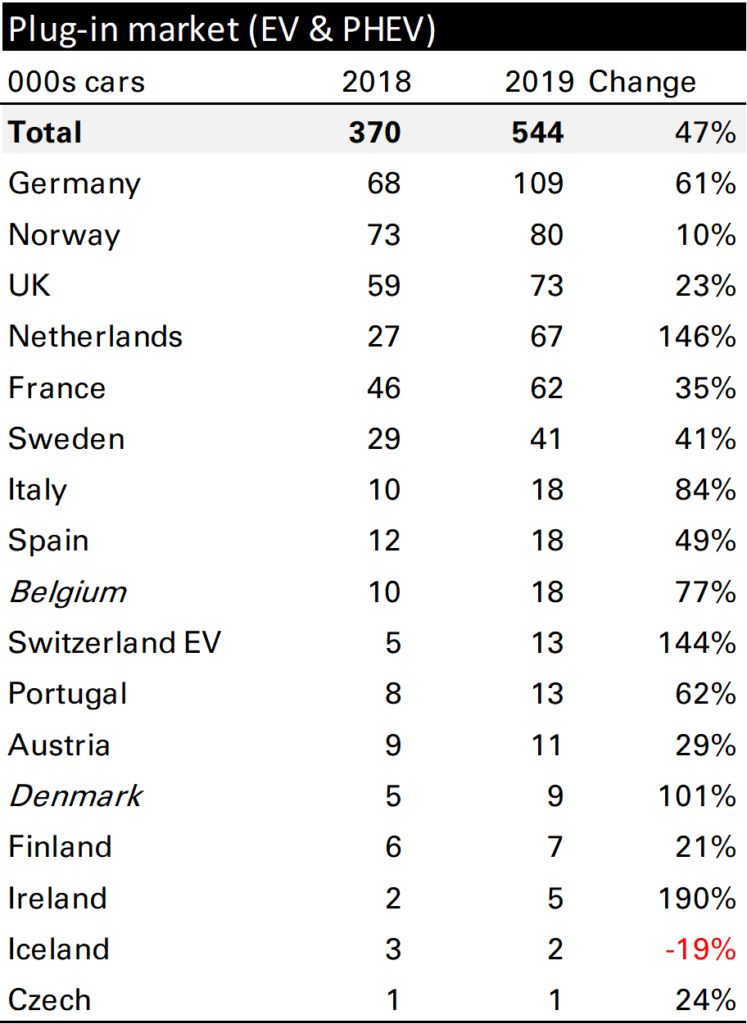
Without the Netherlands European EV sales in December would have been up less than 40%, the level which has been my base case for annual growth for a while. For the year as a whole European EV sales grew 47% (of course helped by that Netherlands surge) to 544k vehicles, a market share of 3.5%, from 370k vehicles, and 2.4% in 2018. Most markets were strong, but of the larger ones Germany stands out, up 61%. It’s also worth noting that BEVs massively outperformed PHEVs, gaining 80% to the latter’s 10%.
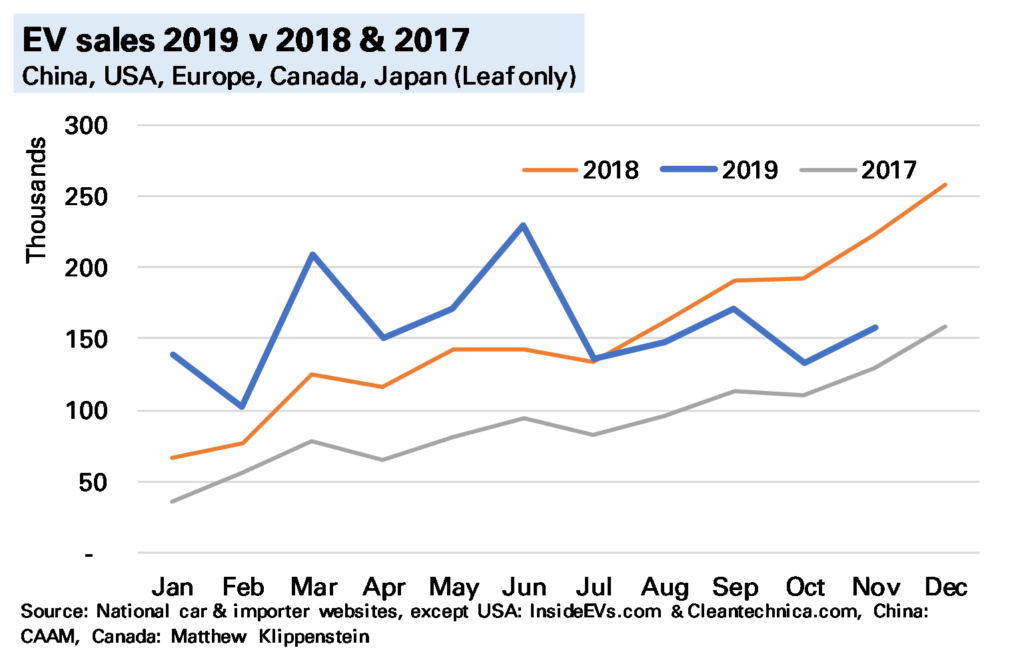
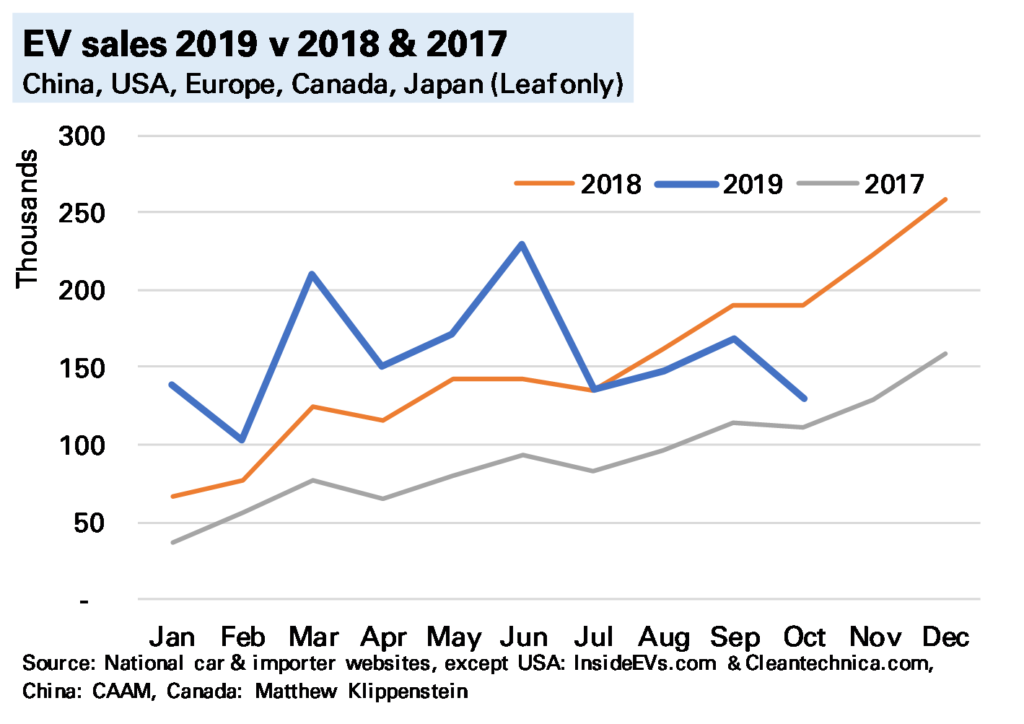
In November global electric vehicle (EV) 1 sales I estimate were about 160k, 29% lower YoY, continuing the slump seen in recent months.
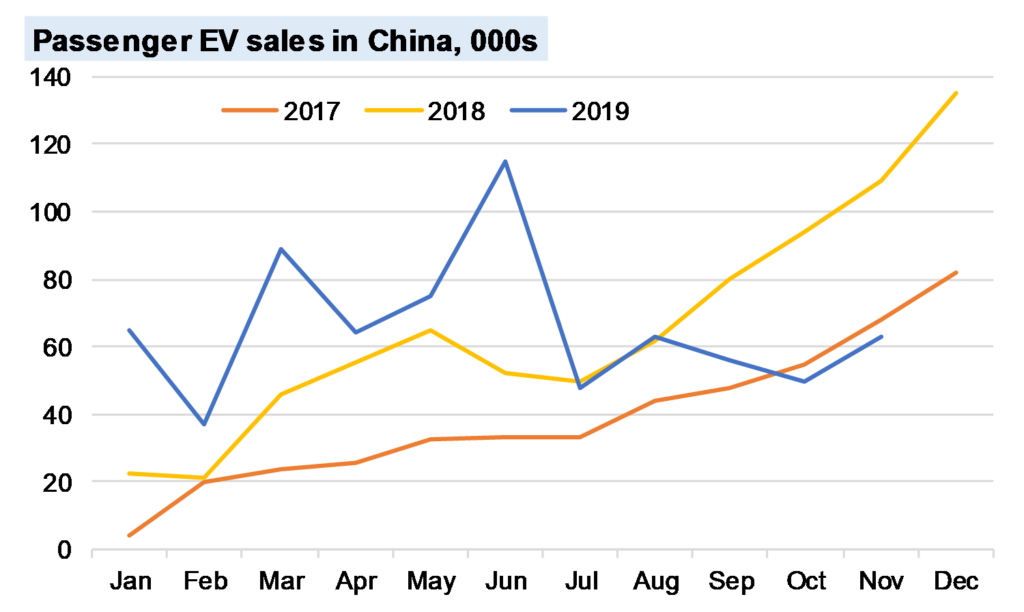
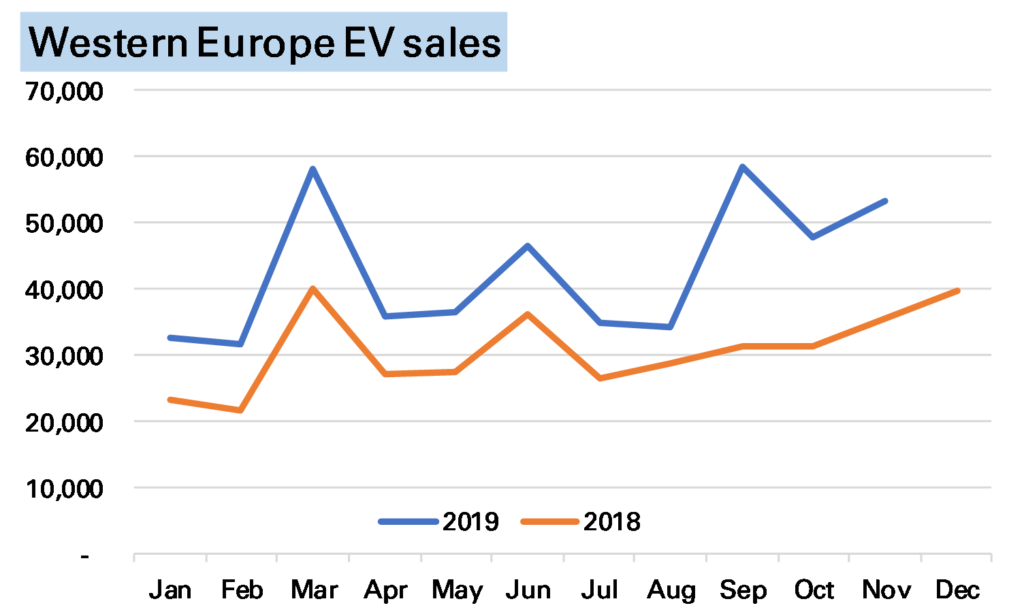
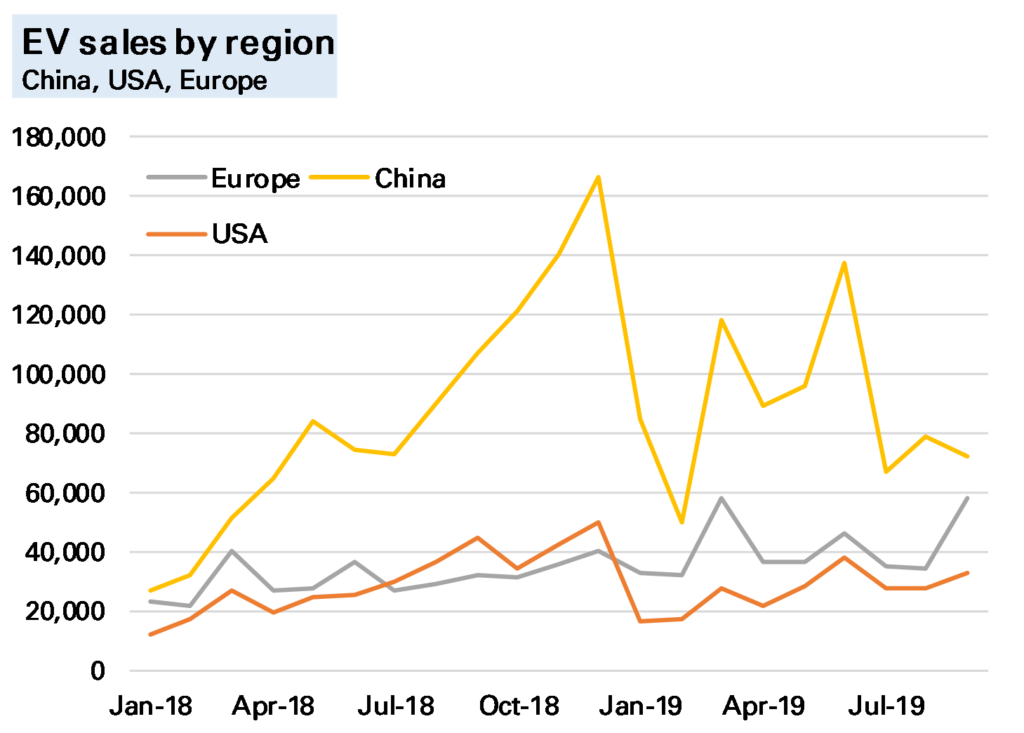
China accounts for most of the slowdown, being by far the largest market and down 45% YoY, little better than in October. Europe, on the other hand, while still a considerably smaller market, posted another solid growth rate of 49% YoY. The difference between the two markets is largely incentives – much lower in China since mid-year but remaining strong in Europe. The USA looks to be running somewhat lower than last year, though we await better data at year-end.
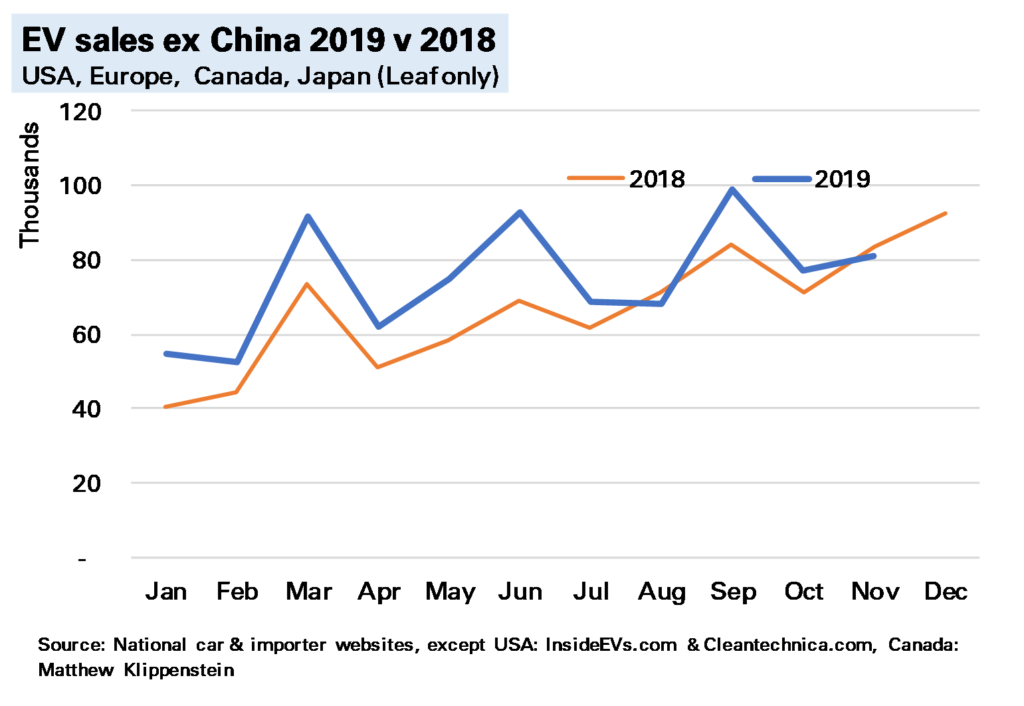
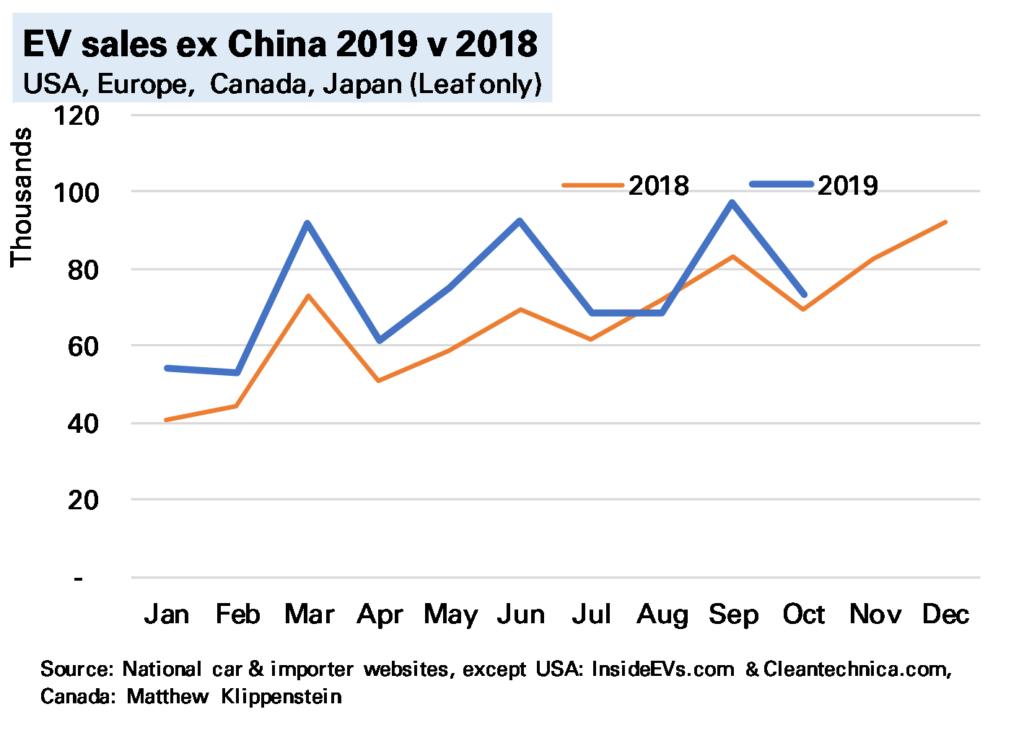
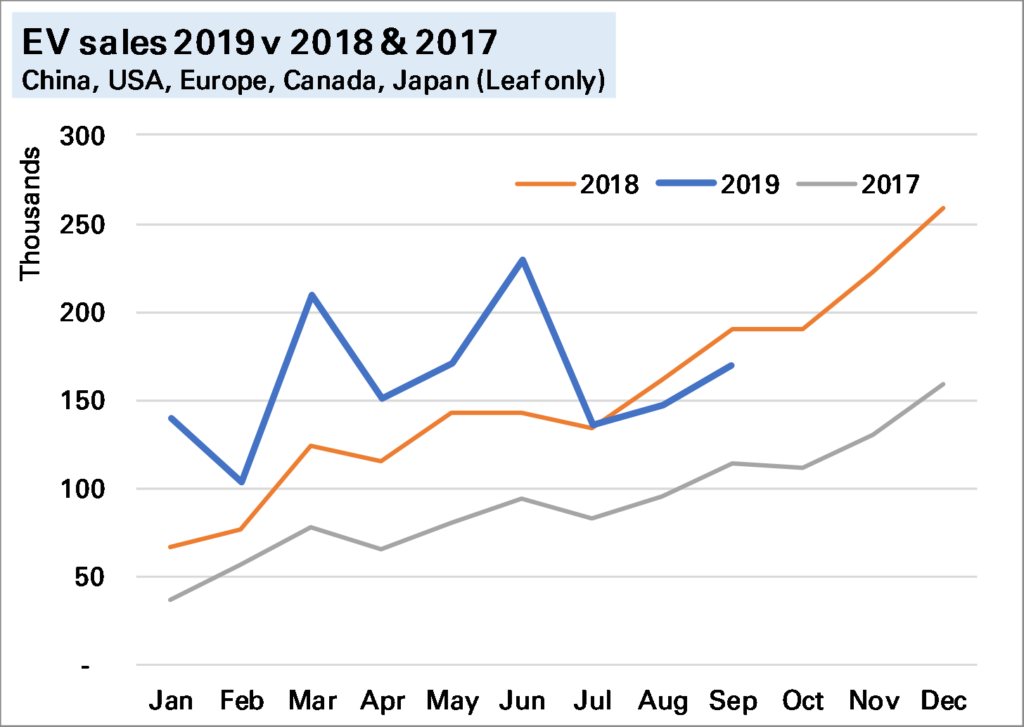
Overall, as the final chart shows, even excluding China, EV sales in November were no higher than in the same month of 2018.
(Note click on charts to show at full size)
With just one month to go it’s clear 2019 has been a disappointing year. Year-end is hard to predict but on current trends global EV sales are likely to be just under 2m, only 6% higher than in 2018. Chinese EV sales are likely to be flat or slightly down, as are US EV sales, while Europe will be up 40-50%. This will mean while China’s share of global EV 2 sales falls from 56% to just over 50%, Europe’s will have risen to 27% from 20%.
Notes:
China, USA, Europe, Japan Nissan Leaf. Exclude Chinese light commercial vehicles – another 10k or so – and perhaps another 10k vehicles in the rest of the world, most notably Korea ↩
Again this excludes the large – 130k or so in 2019 – Chinese commercial EV market ↩
A slump in Chinese electric vehicle (EV) sales drove global EV sales into reverse in October. I estimate, using national and other sources, that 130k EVs were sold during the month (140k if you include Chinese commercial vehicles), 32% lower YoY, with both battery-electric vehicles (BEVs) and plug-in hybrids (PHEVs) down a similar amount.
The sharp global YoY fall is partly because in previous years sales have risen into year-end on a combination of beating expiring incentives and a generally rising market. But sales last month were also lower MoM, and while this owes something to wider market trends, it is mostly due to China.
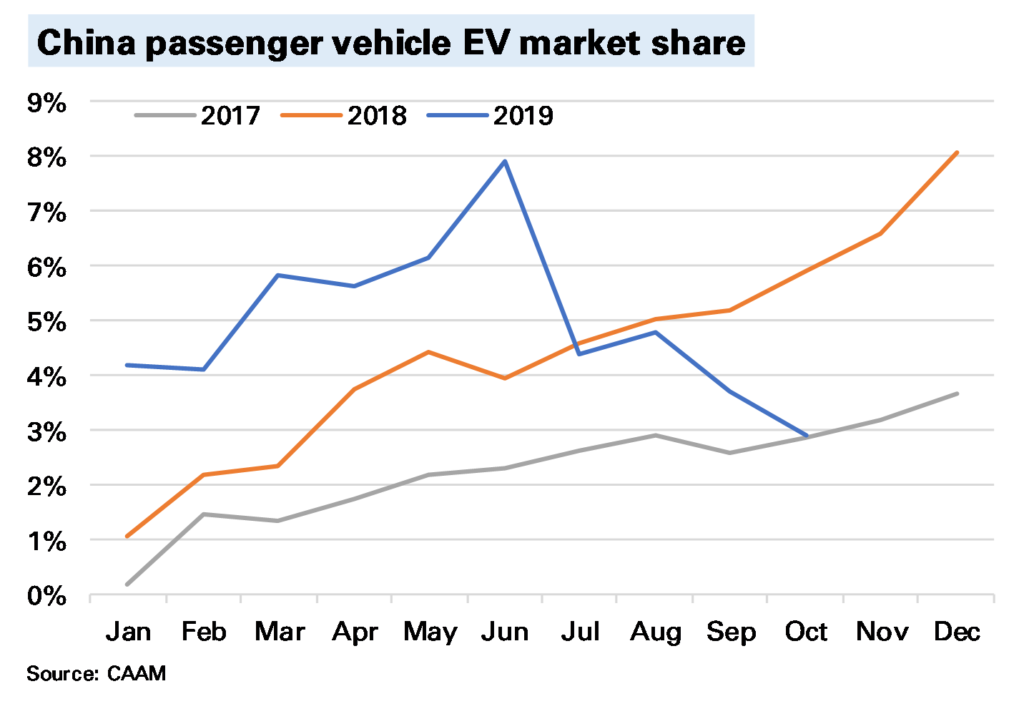
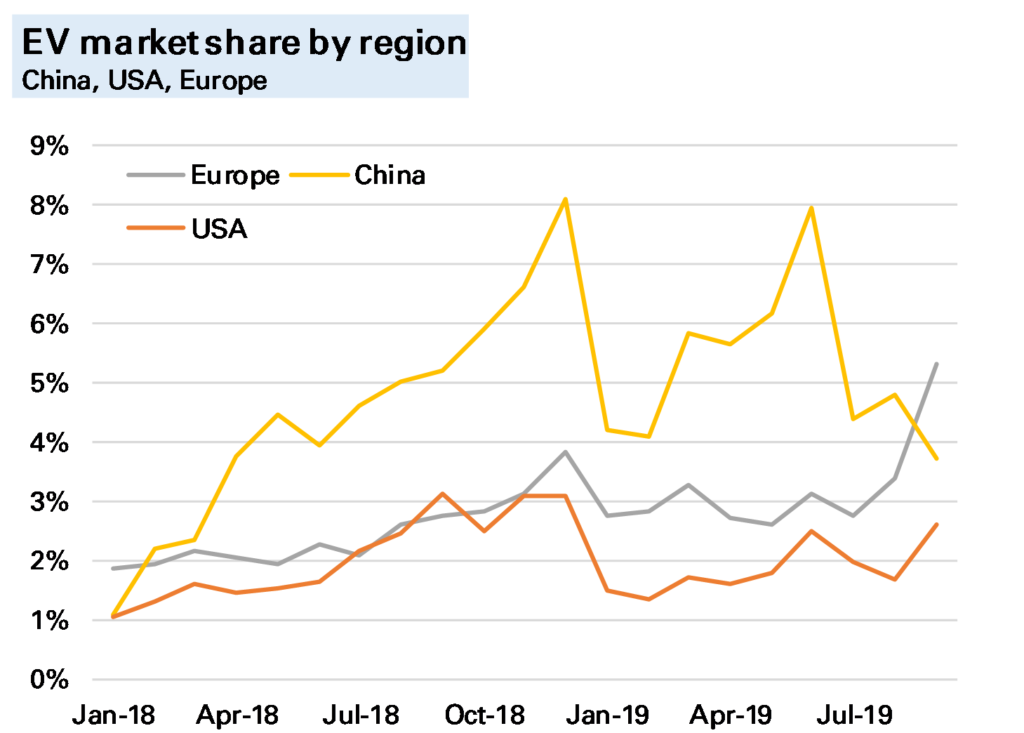
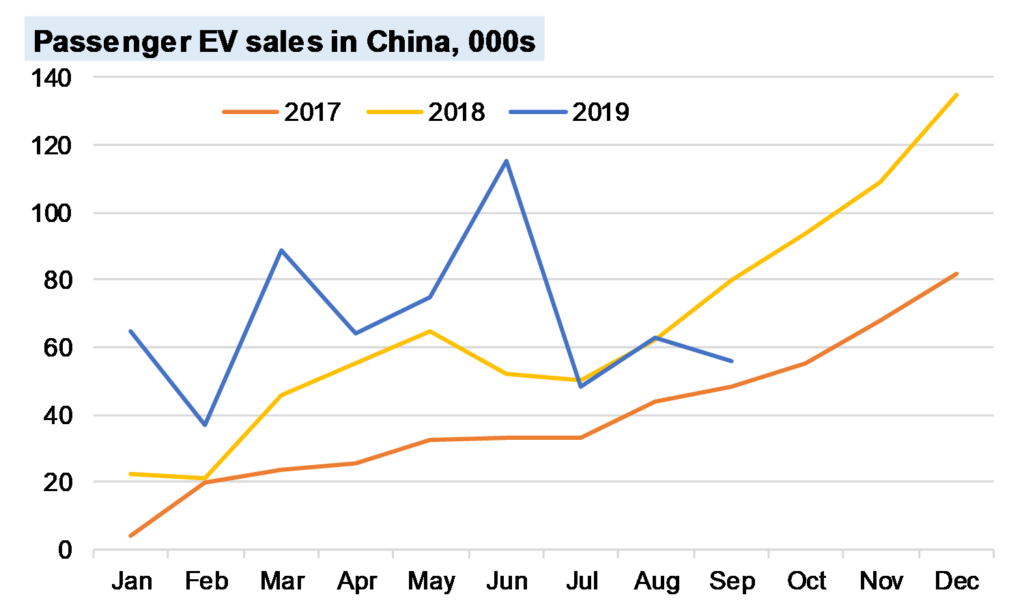
In China, which accounted for 64% of global EV sales in October 2018, EV sales were 54% lower YoY, with BEVs down 47% and PHEVs down 78%. The following chart shows this is not primarily related to a weakening wider market (all passenger car sales were down, but a more modest 6%) but a sizeable fall in market share. The reasons for this we’ve discussed many times before, and are mostly subsidy-driven, though the extent of the slump does point to some consumer disenchantment. Sales for the full-year are now only 18% YoY higher YTD and could end the year lower than in 2018.
If we exclude China then global EV sales were still slightly higher YoY, though note not by much.
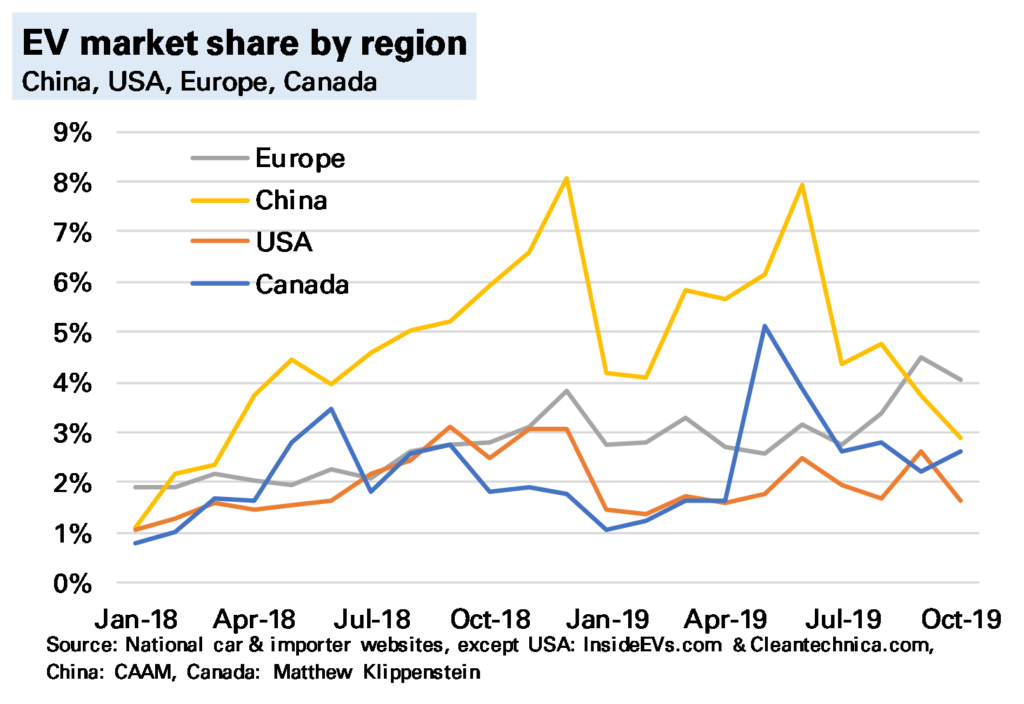
The only bright spot at present is Europe (see my earlier post), where sales were more than 50% higher YoY. And while total EV sales in Europe were still lower than China in October (48k to 56k) the gap has narrowed considerably, and in terms of market share of all car sales Europe has now been higher for two months. Of course this owes something to the Tesla Model 3 roll-out, which is likely to subside, but it does suggest the dominance of the Chinese market in sales is not as obvious as once seen (of course production & battery manufacturer are different questions).
I’ve not said much about the USA, and for two good reasons. One, sales seem subdued, with Tesla concentrating on foreign markets. Two, we are lacking accurate data. The sterling work done by sites such as www.insideevs.com and www.cleantechnica.com in assessing this continues, but a decision by most manufacturers to switch to quarterly data 1 means much monthly data is now guesswork, and for PHEVs I’ve had to make an extrapolation on previous trends. This won’t make a change to our global conclusions – the US does not have a big enough market – but it does mean we need to be cautious on assessing the micro-trends.
My view on the longer-term outlook remains the same. The current slump is a reminder that technological shifts are rarely smooth, and some of the reasons for it (subsidy-issues, consumer reluctance) also point to why EV roll-out will be slower than the more bullish predictions. But subsidies are not all one way – the German government recently announced more generous ones – and consumer reluctance will be overcome by a wider and better range of models. And 2020 still seems a crucial year for that.
Notes:
There is no national or govt tabulation as in many other countries ↩
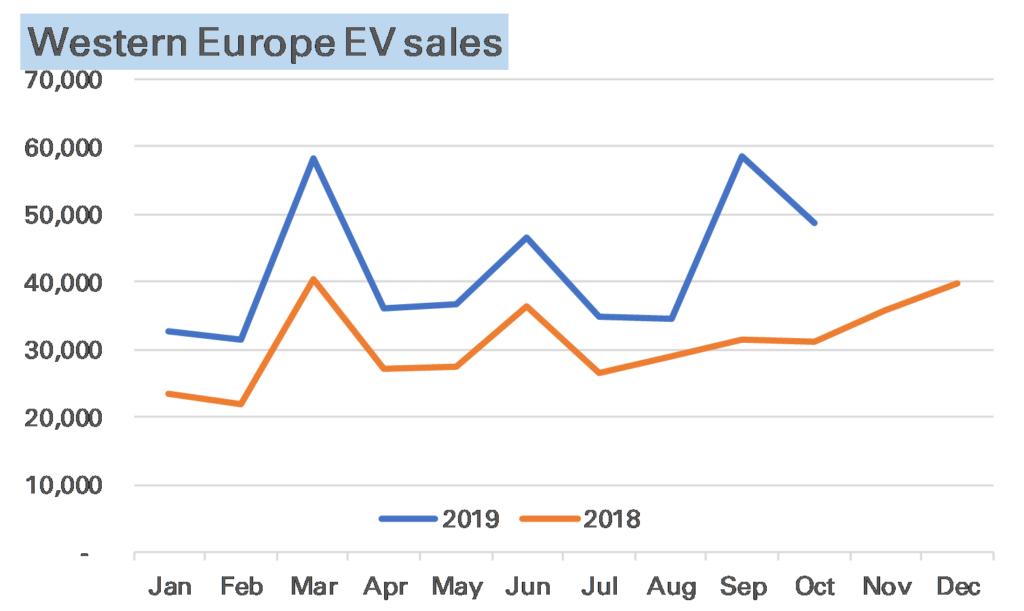
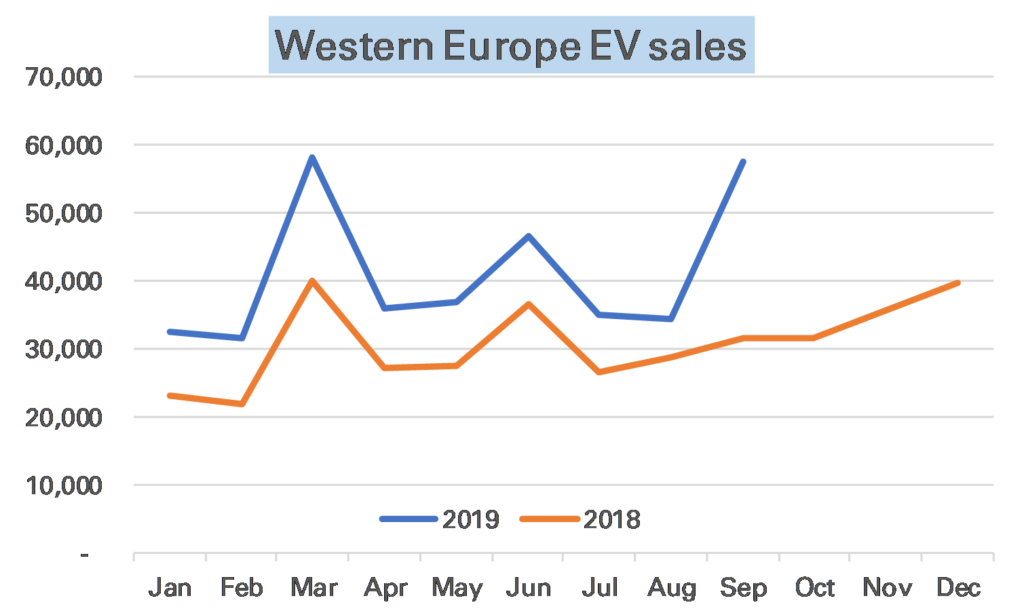
Using national sources I estimate European EV sales were 56% higher YoY in October, with just under 50,000 sold, a market share of around 4%.
Sales were lower than in September, partly a result of the normal trend of European car sales (the UK’s biggest month is in September due to number plate changes) but also because much of the pent up demand for Tesla Model 3s has now been satisfied.
Indeed given this that sales did as well as they did was impressive and due to an unusually high number of PHEVs being sold (see charts 2 and 3), especially in Germany. I don’t have the model breakdown yet to see exactly why this happened. Normally in EVs big changes are subsidy related, but German subsidy changes came only recently and more likely it reflects German marques having released a lot of new PHEV models recently as they are seen as a good way to meet the WLTP test restrictions.
YTD new EV registrations are up 42%, almost spot on my rule-of-thumb growth forecast of 40%.
While global EV sales were disappointing in September, down 11% YoY, those in Europe continue to soar, gaining 82% YoY. And while Europe remains far behind China in EVs sold YTD, at 369k cars, to 792k, in September the two markets were much nearer, at 58k to 72k. In market share, Europe was even a little higher than China, though I wouldn’t want to make too much of this, given I exclude from the totals some smaller EV markets where by definition market share is low.
Will this continue? It’s unlikely. Europe’s EV sales are rising, helped by subsidies and new model launches, though September is likely to prove exceptional given a backlog of Model 3 orders. And Chinese sales should improve into year-end, if not at the same pace as in previous years.
Source: National car data, Insideevs.com, Matthew Turner, October 2019
Globally 170,000 electric vehicles (EVs) were sold in September, 11% lower YoY, with pure EVs (BEVs) falling YoY for the first time. This I calculate using national data released in the last two weeks.
Regionally there was a very strong performance in Europe, where YoY sales were up 82% YoY (note revised from 75% in the linked article), boosted by pent-up sales of Tesla’s Model 3. However in the USA weakening sales of the Model 3 compared to its own, earlier, 2018 boost was a major factor in EV sales falling 26%.
But the biggest impact on the global numbers remains China, and there sales of EVs were very weak, down 34% YoY. With China accounting for around half of global EV sales in September 2018 (and still more than 40% in September 2019) this clearly dragged the global total down.
All Chinese car sales were down 6% YoY, but the slump in EV YoY is more due to reduced subsidies and perhaps some signs Chinese consumers are worrying about value for money, especially resale value. It’s also exacerbated by the strong start to the year and the exceptionally strong end-year performance seen in both 2018 and 2019, which seems missing this time around.
After a few months of a weakening trend, European electric vehicle (EV) sales in September roared (or maybe whined?) back, up a remarkable 75% YoY, led by a 112% gain in pure EVs (BEV) and with even plug-in hybrids (PHEVs) higher YoY.
I estimate total EV sales in the region were just under 58k, nearly matching the highest month in history, March 2019.
Source: European car association data, Matthew Turner, September 2019
What was behind this performance? That it was nearly a record month is partly sign of the market maturing. March & September are traditionally the strongest month for all new car sales in Europe, with number plate changes (particularly in the UK). It now looks like buyers are waiting for these number plates to get EVs too. The YoY acceleration is more interesting. Partly this was because it was a strong month anyway for all new car sales after a weak September 2018 on emissions changes – up 12% YoY on my estimates. Specifically, however, the roll out of Tesla’s Model 3 to Europe continues to have an outsized impact on EV’s market share.
Today marks the last day of the European central bank gold agreement (CBGA).
Announced on September 27 1999, and renewed at five-year intervals up to 2014, this was often described as a pact to limit central bank gold sales and lending, though arguably its main role was to improve market conditions sufficiently to give space for hefty European sales. From around the mid-2000s European central banks lost interest in selling gold, and as such the pact became rather pointless, the main reason why in 2019 it wasn’t renewed.
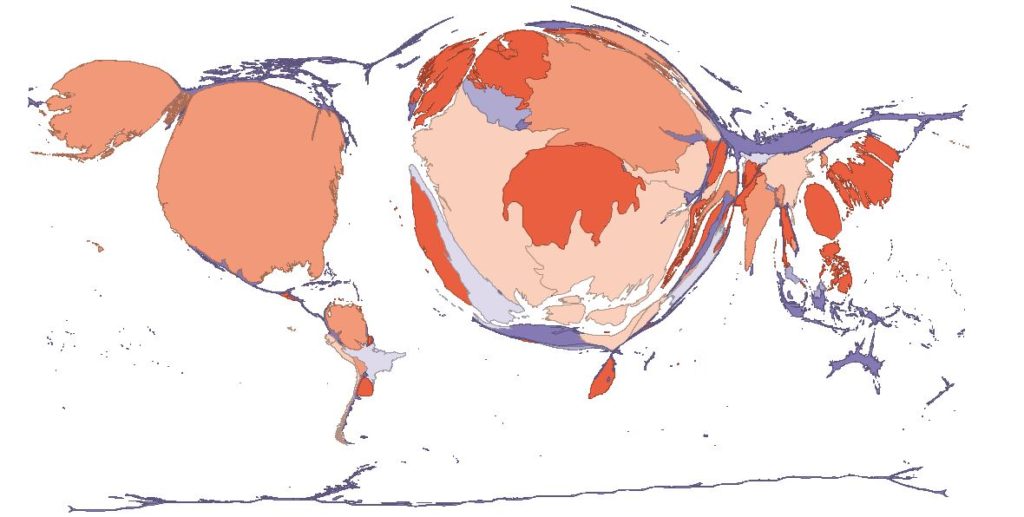
Central bank’s attitudes to gold have changed significantly since 1999. Back then global central bank gold holdings still largely reflected the relative economic strengths of countries at the end of Bretton Woods era (1970s). 85% of the world’s 30,300 tonnes of official gold (excluding that held by the IMF & BIS) was owned by the “Advanced Economies”, and almost all of that, 80% of the world, by the USA and Western European countries.
This geographical skew can be seen clearly in the following map, where I’ve resized the countries of the world by their official gold holdings – shows this clearly (ignore the colours)
Central bank gold holdings by country, September 1999 (source: IMF, Matthew Turner)
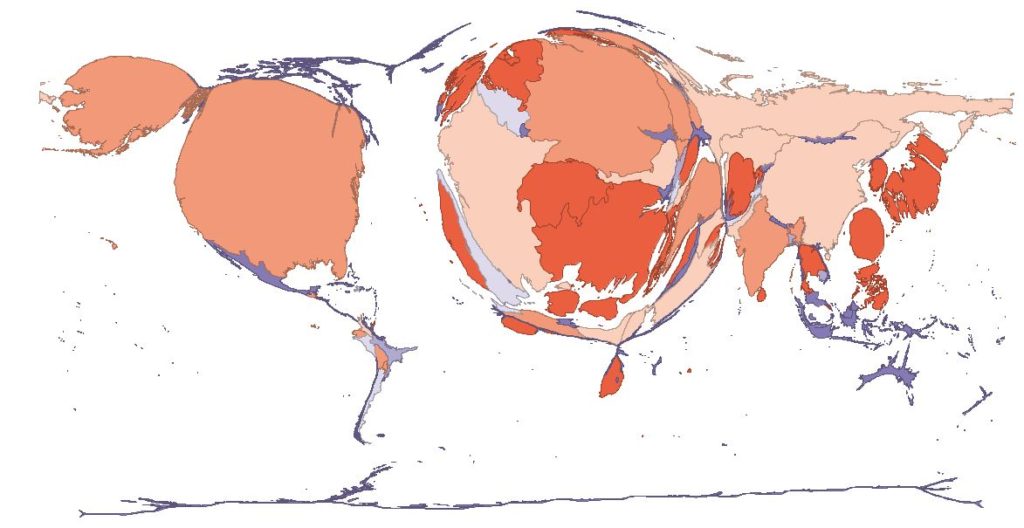
Fast forward 20 years and a map redrawn to reflect August 2019 gold holdings and at first glance nothing much has changed – the USA and Western Europe still dominate, even if the latter is somewhat smaller.
But look a little more closely and now Russia and Asia are far more visible.
Central bank gold holdings by country as of August 2019 (source: IMF, Matthew Turner)
This is because there has been a slow shift since the first CBGA was signed in 1999. The “Advanced economies” have sold nearly 4,000t, mainly through the CBGA – with gold holdings in the Eurozone down nearly 1,800t, in Switzerland 1,580t, and in the UK over 300t. Their share is now 70%, down from 85% in 1999. But globally gold held by central banks is up around 1,000t – because “Emerging and developing” economies have added nearly 5,000t. Russia and other CIS countries have been at the forefront of this, but China has also increased its reserves dramatically, and so have a reasonably wide range of other countries, including India, Mexico, and Thailand.
This shift is likely to continue. Certainly central banks are still buying, as noted in Tuesday’s post, with 1H 2019 seeing a record amount. This trend has many drivers but a slow – very slow – loss of faith in the US dollar seems behind some of it, not just in Russia. We’ve not seen any evidence of European selling resuming, indeed the main activity there purchases this year and last by Hungary and Poland. However I would think in another 20 years Western European gold holdings will be lower than they are today.
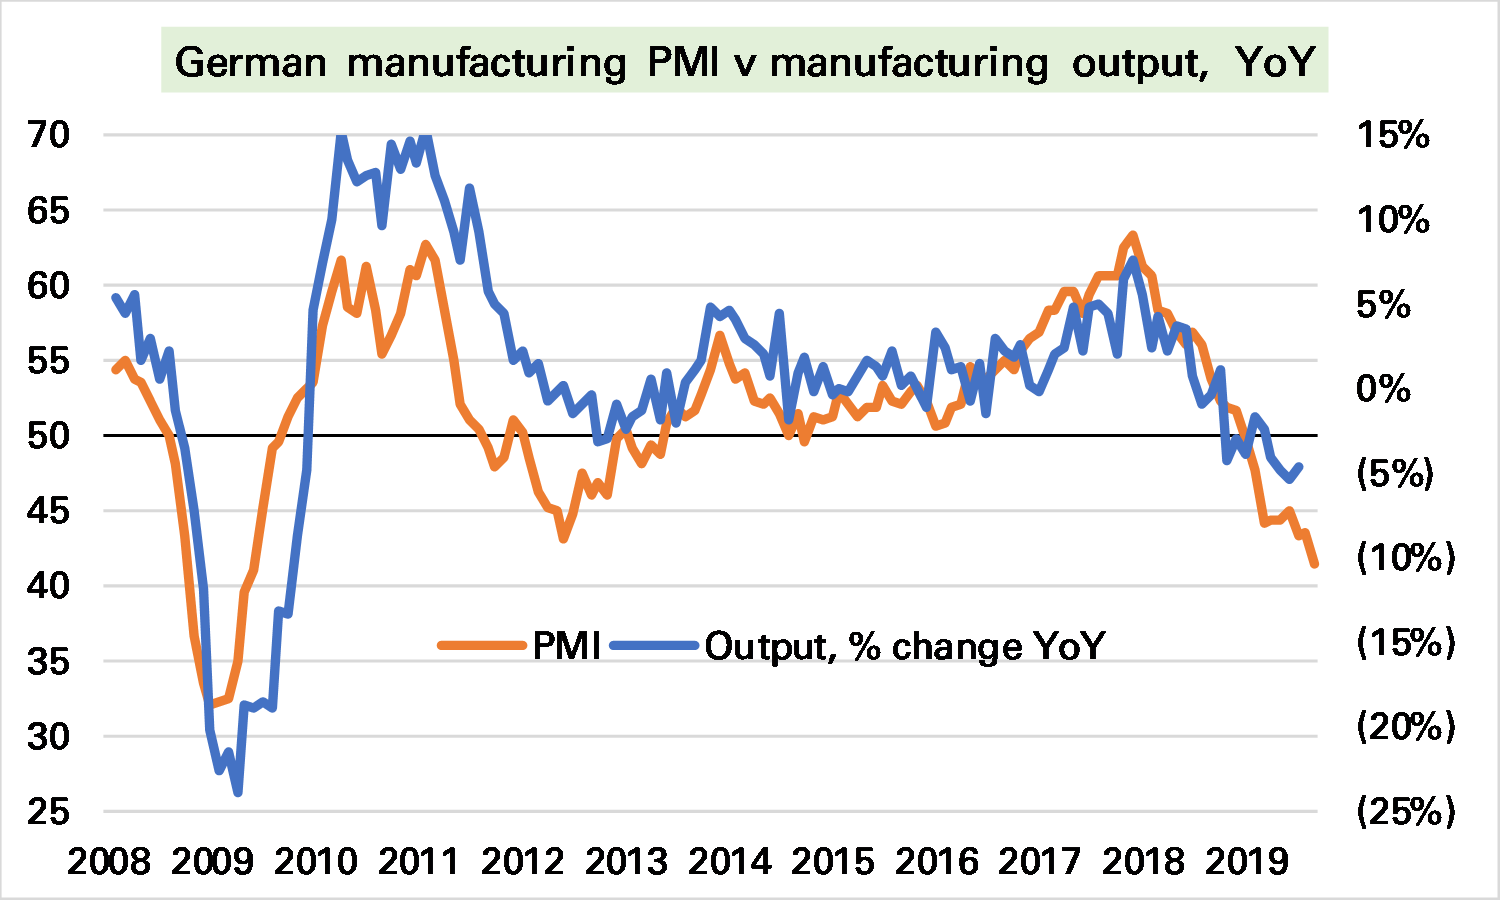
The reason we pay attention to PMIs is that they are much more timely than official data. Today’s PMI is for September, the manufacturing output data it is meant to foreshadow is available only to July.
What it implies, therefore, is more weakness to come. The relationship of the PMI to actual manufacturing output is not hard and fast – but closest at the YoY level (somewhat of a puzzle, though perhaps that is how purchasing managers think). A print of 41.4 historically is consistent with a 10% YoY slump in output, but we can’t be confident in that given the limited number of datapoints available (for example in 2012 such a relationship would have been too pessimistic). A safer conclusion is that we are very unlikely to see any German output growth over this period.
The FT quotes (limited paywall) environmental group Transport & Environment that they expect EV sales in the EU to pass 1m next year, from 250,000 in 2018 and 200,00 in 1H 2019.
This is an aggressive forecast. I don’t have the same historical numbers as they do, even excluding Norway and Switzerland from my data. Perhaps this is because the article says they include PHEVs only with a “significant range”, though I’d have thought that was to exclude mild-hybrids. But in any case my rule-of-thumb of 40% annual gains, similar to the YTD position, would imply (on their numbers) 350k this year, and just under 500k next. Much less than 1m.
Clearly the launch of new models such as the VW ID3 will make a big difference, but my understanding is that won’t be available in large numbers until later in the year. I’ll try to find out more information on their assumptions.
ps Here’s their press release and there seems to be a report. On a quick glance it looks like it might be a “look this is possible” target rather than an expection.